Energy

Chapter four | Energy

Better energy, better climate

Download chapter

Main Points

Fast-rising energy demand will require some US$45 trillion in new infrastructure investment by 2030. This is an opportunity to build more efficient, less polluting, more flexible energy systems that are also less vulnerable to rising and volatile fossil fuel prices.

The choices made in next 15 years are also critical for the climate, as energy production and use already account for two-thirds of global GHG emissions. A large-scale shift to low-carbon energy supplies is crucial for avoiding levels of dangerous climate change.

Coal now accounts for over 40% of global electricity production, but there are compelling reasons to reduce that share. Coal accounts for 73% of power sector GHG emissions, and its use in power generation and industry can also result in severe air pollution. Moreover, fast-growing economies such as China and India are having to import coal as domestic supplies cannot keep up with growing demand. These factors make it sensible to shift the “burden of proof”, so that coal is no longer the default choice for new power plants, but the last resort if no better options can be found.

Key renewable energy sources have fast gone from prohibitively expensive to realistic options for future energy supply, and for the generation of electricity in particular. The cost of wind power is one-third or one-quarter what it was 25 years ago; solar power costs have fallen by half just since 2010. Thus, the cost gap between renewables and fossil fuels is narrowing, and in some markets, renewables are already cost-competitive – even more so if their multiple benefits are considered.

Energy efficiency offers large potential to meet future energy needs without resorting to more marginal and harmful sources of energy. In developed countries, it is already the biggest source of “new” energy supply, but large untapped potential remains. Developing countries have even more to gain by managing demand. India’s energy requirements in 2030, for example, could be as much as 40% greater in a scenario of low energy efficiency than in one with high energy efficiency.

Natural gas has become a key energy source in many markets, displacing coal and reducing GHG and air pollution impacts. For gas to be a potential “bridge” to lower-carbon energy systems, there must be strong policies to limit fugitive methane emissions, put a price on carbon emissions, and continue to drive a shift towards lower-carbon technologies.

Chapter four | Energy

Introduction

Energy is vital to modern economies: for industry, transport, infrastructure, information technology, building heat and cooling, agriculture, household uses and more. Any nation that wants to grow its economy and improve living standards must secure a robust energy supply. As incomes rise, so does energy use: high-income countries consume more than 14 times as much energy per capita as Least Developed Countries, and seven times as much as lower-middle-income countries. 1 As more countries rise out of poverty and develop their economies, energy demand will rise with them, putting pressure on local supplies as well as global energy systems.

Energy is costlier, prices are more volatile, and for several fast-growing countries, supplies are now also less secure. There is a need to reconsider which energy options are lowest-cost and “safe bets”; the advantages of coal in particular have been eroded as large, fast-growing economies find their domestic supplies cannot keep up with demand, some regions have seen low-cost gas emerge as an alternative, and many grapple with air pollution and other social costs. Reducing coal use is also crucial to reducing climate risk.

Responding to these new challenges will require a multi-faceted approach. One key task is to increase resource efficiency and productivity – to make the most of our energy supplies. Some countries have already made significant gains in this regard, but there is much untapped potential. Innovation also is expanding our energy options: from the revolution in unconventional gas and oil, to the rapid growth of renewable energy resources, most notably wind and solar power. In many countries, falling costs are already enabling renewables to become a mainstay of new energy supply. Maintaining the speed of innovation will further expand these opportunities.

A massive wave of energy infrastructure investment is coming.

Policy-makers face crucial choices in the next few years. A massive wave of energy infrastructure investment is coming: to keep up with development needs, around US$45 trillion may need to be invested in the next 15 years.2 This gives countries a chance to build robust, flexible energy systems that will serve them well for decades to come, but it also represents a critical window to avoid locking-in technologies that expose them to future market volatility, air pollution, and other environmental and social stresses. Investing in energy efficiency and low-carbon technologies may increase upfront costs, but it will also bring multiple benefits.

This chapter explores key issues for energy systems in countries at different stages of development. We start by noting major energy trends around the world, then take stock of “seeds of change” that may offer opportunities for countries to strengthen and diversify their energy systems and improve productivity. We also assess some of the barriers to change, which can be considerable, and discuss ways to overcome them, which may require new decision-making frameworks, business models and financing arrangements. Like major changes in the past, transforming energy systems will require deliberate effort. We end the chapter by identifying concrete steps that can be taken in the next 5–10 years.

Energy is a broad topic, and our analysis is not comprehensive. While we discuss other sectors, we give priority to electricity production, which is crucial to economic growth, is increasing rapidly, and offers significant near-term opportunities for improvement. Most models for mitigating climate change also agree that the electricity production has the largest potential for rapid reductions in energy-related CO2 emissions, while decarbonising other sectors will be slower. 3

Key energy-related issues are also covered in other chapters. Chapter 2: Cities examines how more compact urban forms can reduce energy use, especially for transport; Chapter 3: Land Use and Chapter 7: Innovation both discuss biofuels, and Innovation examines how policy can support and accelerate technological advances that could fundamentally change energy consumption and supply patterns. Chapter 5: Economics of Change addresses the role of carbon pricing and the need to reform fossil fuel subsidies, and Chapter 6: Finance looks at stranded-asset risks and at ways to reduce financing costs for low-carbon energy.

A changing energy landscape

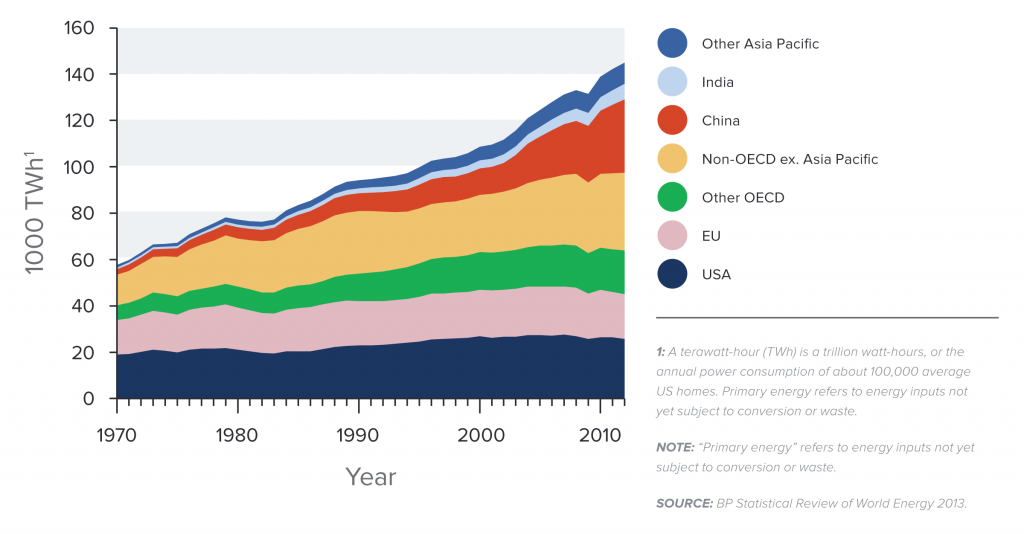
We are in a period of unprecedented expansion of energy demand. Energy use has grown by more than 50% since 1990,4 fuelling a global economy that has more than doubled in size. 5 As much as a quarter of current world energy demand was created in just the last decade. In the 1980s and 1990s, energy demand growth was roughly evenly split between Organisation for Economic Cooperation and Development (OECD) and non-OECD countries, but since 2000, against most predictions, all of the net growth has occurred in non-OECD countries, with China alone accounting for more than half of the increase. 6 Past projections often failed to anticipate these dramatic shifts, which nonetheless have affected the energy prospects of nearly all countries. The future is now even more uncertain, as projections show anything from a 20% to 35% expansion of global energy demand over the next 15 years. 7

The exact nature of the change that this will bring cannot be known with any certainty. Given the economic importance of energy, however, countries need to ensure that their energy systems are robust and able to adapt to a range of possible future scenarios.

Figure 1

Global primary energy consumption by region 1970-2012

Notes

A terawatt-hour (TWh) is a trillion watt-hours, or the annual power consumption of about 100,000 average US homes. Primary energy refers to energy inputs not yet subject to conversion or waste.

Source(s)

BP, 2013. 9

Fossil fuels now provide 87% of our primary energy supply: oil (33%) is used mostly in transport and petrochemicals production, while coal (30%) is a mainstay of electricity production and some industries; natural gas (24%) is gaining ground across sectors, from electricity and heat production to manufacturing.10 These global shares have changed only slowly, but conceal disparate trends. Coal use has grown by nearly 70% since 1990, but almost entirely in a handful of countries (China alone accounted for 90% of the increase). In the rest of the world, coal provides just 16% of energy, and the large majority of new supply outside transportation has involved natural gas.

Electricity demand grows fast as countries develop, with increased reliance on electricity to meet a range of needs. Electricity’s share of energy use has nearly doubled in 40 years and looks set to increase further. 11 Close to 40% of all energy is now used to produce electricity; 63% of coal is consumed for this purpose, and 41% of power comes from coal-fired plants. 12 Twenty countries rely on coal for more than half their electricity production, but 30 others get more than half their power from natural gas, 34 from hydropower, and a handful from nuclear power. 13 In recent years, renewable energy sources, particularly solar and wind power, have been growing rapidly, and non-hydropower renewables supplied 4.7% of electricity in 2012, more than double their share in 2006. 14

Given the recent record, it seems unwise for any country to bank on a future of low, stable fossil fuel prices.

Global energy markets have also undergone major changes that affect all countries. Prices are much higher overall: oil and natural gas prices are three to four times higher in real terms, and coal prices are twice as high, as 25 years ago. Even in the shale-gas-rich United States, gas prices are almost twice what they were in 1990. 15 Although global gross national product (GDP) is twice as high, the share we spend on energy has risen from 8% in 1990 to 10% today, and while total energy use has increased by one-third, more than 80% of the increase in expenditure since 2000 has been due to increasing prices. 16 Fossil fuel prices also are more volatile, with larger, more frequent and more unpredictable fluctuations, which can depress investment and cause other economic damage. It is unclear whether this pattern will continue: as with energy demand, past forecasts of energy prices have proven to be poor guides to the future. Given the recent record, however, it seems unwise for any country to bank on a future of low, stable fossil fuel prices.

Adding to the uncertainty is a steep rise in energy trade. Not only is 62% of oil internationally traded, 17 but increasingly, so are coal and natural gas, which have historically been produced and consumed domestically. Combined with high prices, this puts pressures on the balance of payments in several countries. Given that oil and gas reserves, especially, are highly concentrated – in each case, just five countries hold more than 60% of proven reserves  18 – importers worry about energy security. Up to now, coal’s local availability has been a big part of its appeal, but increasingly, major coal users (India in particular, and to some degree also China) are having to rely on imports to cover much of their demand growth.

Finally, the environmental impacts of fossil fuel use have become hard to ignore. Many countries are struggling with severe air pollution, especially in urban and industrial areas; China is the most visible example, with public outrage about air quality leading the government to launch a “war on pollution” in early 2014. 19 Concerns about climate change have also escalated. Energy use already accounts for two-thirds of global greenhouse gas (GHG) emissions, 20 and those emissions continue to rise. The future of the climate therefore depends, to a great extent, on whether we can reverse this trend and meet the world’s energy needs with low-carbon systems (see Box 1).

Box 1 — Carbon budgets and emissions from energy use

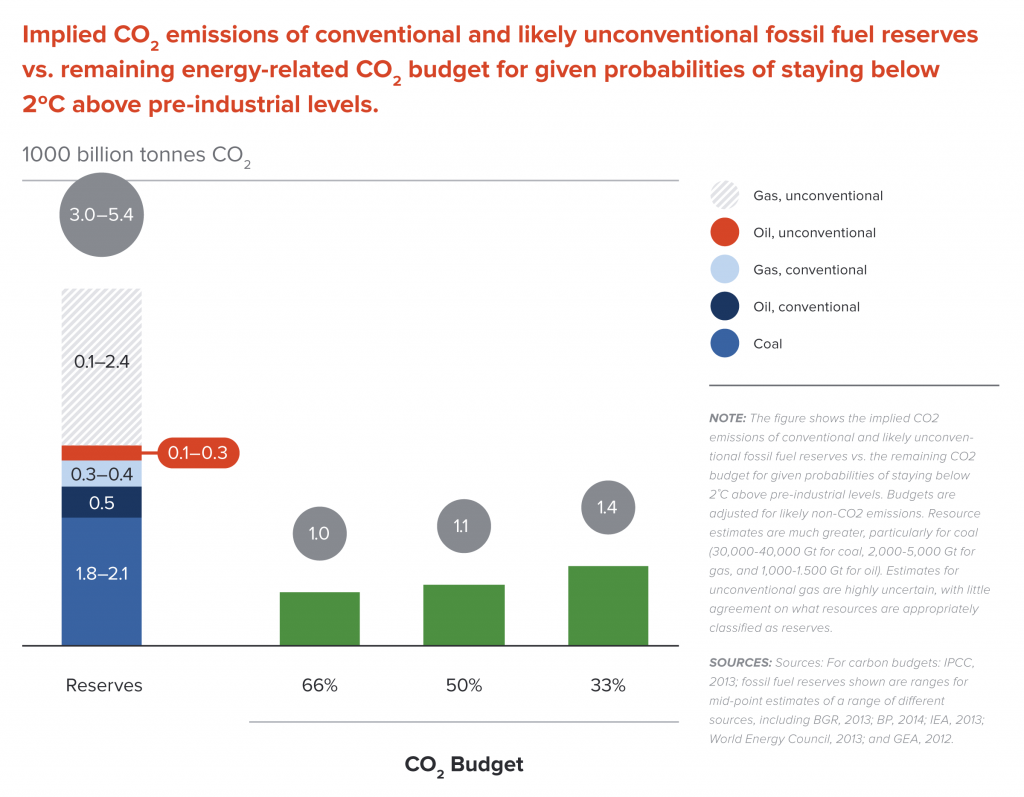
Climate impacts depend on the total emissions accumulating in the atmosphere. The Intergovernmental Panel on Climate Change (IPCC) has estimated that for a 50% chance of limiting global warming to 2°C, cumulative GHG emissions up to 2100 cannot exceed 4.4 trillion tonnes of CO2 equivalents (CO2e). 21 After discounting past emissions, and accounting for non-CO2 greenhouse gases, just over 1.1 trillion tonnes remain for CO2 emissions from human activities, including energy use. This thus sets a “carbon budget” for GHG emissions.

Yet proven fossil fuel reserves (i.e. resources that can be economically recovered) would release far greater volumes if burnt. Coal reserves alone would exceed it by a factor of almost two. Though estimates are uncertain, fully exploiting coal, oil and gas reserves could mean an overshoot up to a factor of five (see figure). There are also vast resources beyond these reserves (estimated up to 50 times the CO2 budget), though it is unknown what share of these might become economically viable to extract in the future.

Containing climate change to safe levels will require reducing GHG emissions by up to 90% between 2040 and 2070, the IPCC has said. 22 Yet energy emissions are rising rapidly. Growth in energy supply sector GHGs accelerated from 1.7% per year in 1991─2000 to 3.1% per year in 2001–2010. 23 Energy CO2 emissions are more than 40% higher now than when the Kyoto Protocol was signed in 1997. 24 Several studies have found, however, that it would be technically feasible to meet energy needs while sharply curbing emissions, and that the cost, while substantial, is manageable on a global scale. 25

Figure 2

Implied CO2 emissions of fossil fuel reserves vs. remaining CO2 budgets for a 2˚C pathway

Notes

The figure shows the implied CO2 emissions of conventional and likely unconventional fossil fuel reserves vs. the remaining CO2 budget for given probabilities of staying below 2˚C above pre-industrial levels. Budgets are adjusted for likely non-CO2 emissions. Resource estimates are much greater, particularly for coal (30,000-40,000 Gt for coal, 2,000-5,000 Gt for gas, and 1,000-1.500 Gt for oil). Estimates for unconventional gas are highly uncertain, with little agreement on what resources are appropriately classified as reserves.

Source(s)

For carbon budgets: IPCC, 2013; fossil fuel reserves shown are ranges for mid-point estimates of a range of different sources, including BGR, 2013; BP, 2014; IEA, 2013; World Energy Council, 2013; and GEA, 2012. 26

The evidence suggests that, without a deliberate change of direction, fossil fuel use will continue to grow, and so will its economic, security and environmental impacts. There is no imminent “peak” that will slow this trend; the world is not “running out” of fossil fuels. The cost of developing and extracting new resources is increasing: global investment in fossil fuel supply chains rose from US$400 billion in 2000 to US$950 billion in 2013, and 80% of upstream oil and gas spending through the 2030s is expected to be used to compensate for declining production at existing fields. 27 Conditions are also shifting in other, fundamental ways:

China’s energy use has nearly tripled since 2000, mostly fuelled by coal. 28 This phenomenal increase has been accompanied by strong economic growth, but also resulted in a highly energy-intensive economy with significant distortions, high levels of air pollution, and an emerging need to import energy. Changing direction will be a Herculean task, closely connected with efforts to achieve a more service-based economy. Chinese policy is already responding, with measures including industry restructuring, new infrastructure for urban heating, major international gas deals, and promoting alternatives to coal in power generation. Some analyses suggest coal use could peak or level off in the early 2020s as a result. 29

India’s energy use has nearly doubled since 2000 (though just to one-fifth of China’s use). 30 Yet much of the population still lacks access to modern energy, and there are long-standing difficulties investing domestically in new supplies, not least because prices are kept too low to make new investments viable. In recent years, the country has sourced nearly half its new coal use from abroad, and the electricity system, once almost entirely fuelled by domestic resources, increasingly depends on imports to meet new demand. 31 This new dependence raises both geopolitical and balance-of-payments concerns. India also cannot ignore where future energy growth will take it in terms of air pollution, as many Indian cities already have worse air quality than Chinese cities, even prior to a heavy industrial expansion. 32

The United States, always rich in energy resources, has made a concerted effort to increase domestic energy production. It may become the world’s top oil producer by 2015, and be close to energy self-sufficiency in the next two decades. 33 A surge in low-cost gas supply has reduced energy prices and reduced demand for coal, which until recently provided half of US electricity. 34 Stricter environmental standards are also making coal less viable; new wind power and even solar photovoltaic (PV) electricity can be less costly than new coal-fired plants. Overall, coal-fired power has accounted for just 5% of new generation since 2000, closures of plants have accelerated, and proposed regulations would require that any new coal be fitted by carbon capture and storage (CCS). Energy efficiency has also improved, and in some states may in fact stall demand growth in the next decade. 35

The European Union (EU) is recasting its energy systems, with strong policies in place to cut CO2 emissions, increase renewable energy, and improve energy efficiency. Climate objectives are a major driving force behind this transformation, but energy security is also a strong motivation. The EU has been pioneering new approaches to energy supply, and in particular has driven the adoption of renewable energy for electricity generation. There have been remarkable successes, not least in helping spur innovation that has reduced the cost of low-carbon energy – but those investments have also been politically controversial. Meanwhile, the flagship climate policy of carbon pricing through emissions trading has failed to generate a sustained price signal to give investors certainty. Policy now needs realignment, including to ensure the reliability of the electricity system.

The Middle East is facing constraints from inefficient energy use. Primary energy use is growing at more than twice the global rate, 36 driven by rapidly growing populations and policies that keep energy prices very low. Yet it is far from clear that cheap energy is helping the economy. While around the world, energy productivity (the amount of economic value created per unit energy used) is rising, here it is falling. The cost in terms of forgone export revenues is high and rising, as domestic demand eats into the surplus available for export. National oil companies in some countries are constrained in their ability to finance investment in new fields.

Latin America and the Caribbean haveseen energy demand increase by one-third in just a decade amid growing industrialisation and regional commerce. 37 It has a high share of renewable energy (25%), with extensive use of hydropower in several countries and potential for further growth, although social and environmental impacts are a concern. Natural gas use has risen twice as fast as energy demand overall, but with only 4% of global reserves, the region imports most of its supply. 38 Wind power has grown rapidly in Mexico, which has some of the lowest costs in the world, about US$60 per megawatt-hour (MWh), as well as in Brazil, Uruguay and some Central American countries. The region also has great solar potential and is increasingly exploiting it.

Most countries in sub-Saharan Africa and South Asia are still struggling to scale-up their energy systems to fuel economic growth and provide modern energy services to all. Power supplies are often unreliable, and large shares of the poor urban and rural populations lack basic energy access. 39 Average per-capita energy consumption in sub-Saharan Africa is one-seventh of that in high-income OECD countries, and in South Asia, it is one-ninth.40 Aiming to close these gaps, countries in both regions – individually and through regional networks – are making massive new investments in energy infrastructure – including grid expansion, large-scale coal power and hydropower, and increasingly, wind and solar. 41

These examples make it clear that there is no single way forward, but “business as usual” is unlikely to persist. In the following sections, we delve deeper into the new strategies that countries are pursuing, as well as into the factors that may inhibit change.

Seeds of change

Global energy systems are evolving on many levels. Here we focus on a few areas with significant potential for achieving climate and economic goals together, and where decisions in the next five to ten years are crucial:

  • A changing outlook for coal power;
  • Air pollution as a driver of energy system transformation;
  • The emergence of renewable technologies as large-scale, cost-competitive energy sources;
  • A growing focus on off-grid approaches to expanding energy access;
  • A surge in natural gas use, often replacing coal; and
  • Advances in energy efficiency, with significant untapped potential. 42

We call these “seeds of change”, and if they can be successfully grown to large-scale change, they could provide a foundation for a more productive, low-carbon future energy system.

A changing outlook for coal power

The rise of new opportunities is occurring at a time of increased challenges to established solutions to expand energy supplies, as noted above. Coal in particular has been abundant and affordable for many generations, and in several fast-growing economies, it remains the default option for rapid expansion of the electricity supply, as well as the key source of energy for heavy industry. Coal power has proven scalable, reliable and controllable, and institutions, grid arrangements, and financing systems are set up to support it. Moreover, coal-rich countries have been able to rely on locally available (and thus secure) supplies at times at costs as low as US$20/tonne (t) and, until the last decade, often with a backstop price of no more than US$50/t. Even at higher prices than these, coal can be the cheapest option (in pure financial terms) for new electricity production.

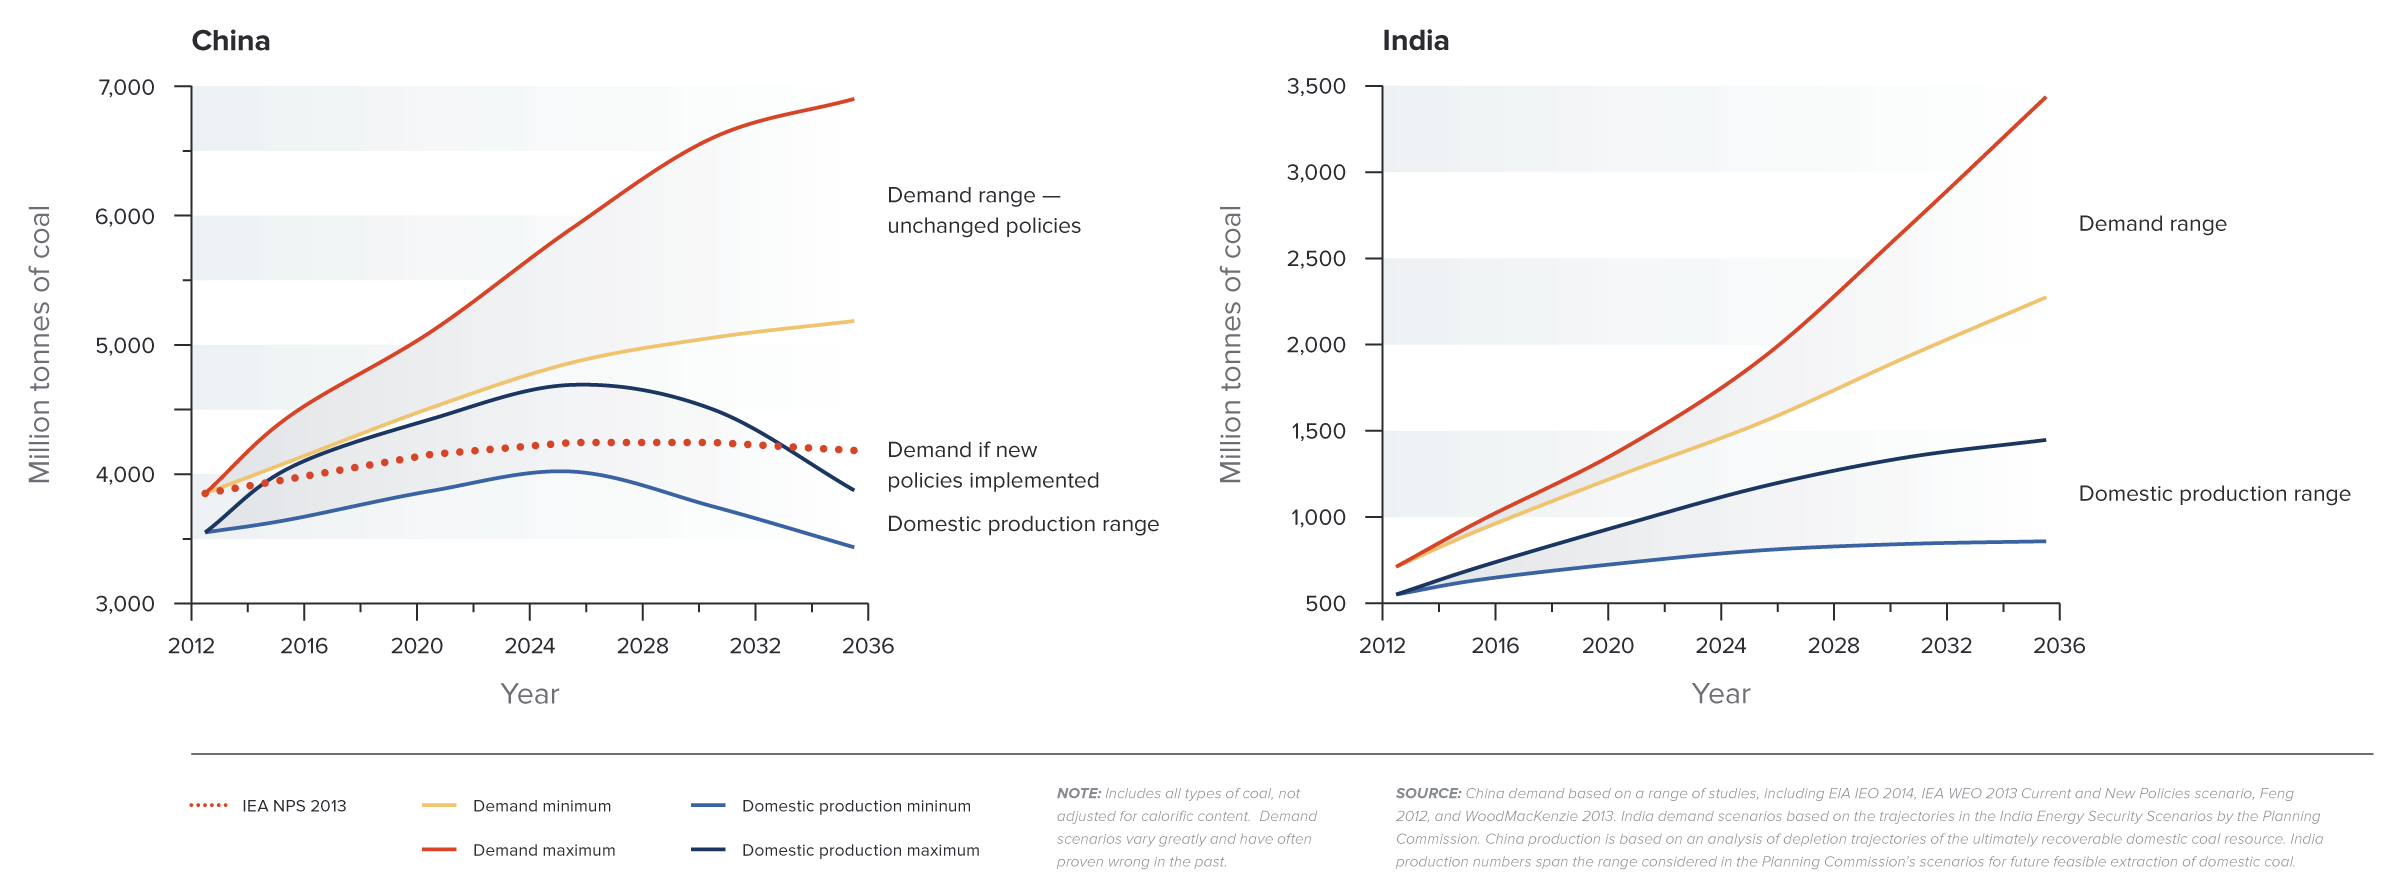
But as noted above, conditions are changing, driven by fast-rising demand and a sharp increase in coal trade. Since 2007 China has gone from a net coal exporter to the world’s top coal importer, buying almost one-quarter of the global trade. 43 Work for the Global Commission indicates that the domestic supply-demand outlook is highly uncertain. Continuation of past trends would lead to a drastically changed energy security situation: in a scenario of continued energy-intensive growth and reliance on coal, China might need to import more than half of its additional coal requirements over the next 10–15 years. 44 Such a scenario may be unlikely, as China has other strong reasons to curb coal use, not least concern with air pollution and ambition to diversify the economy. Energy security adds to the reasons to seek different, less coal-intensive patterns of both energy supply and economic activity.

India has followed a similar trajectory: from near self-sufficiency a decade ago it is now meeting half of growth in coal requirements through imports. It is now the third-largest importer, after China and Japan. 45 Unless it can manage demand growth through improved efficiency and find new sources of electric power, some scenarios suggest it may have to import even larger shares of its coal. 46

Figure 3

Ranges for domestic coal production and coal demand scenarios in India and China, 2012-2030, absent change in policies

Notes

Main ranges for demand scenarios do not assume policy changes to encourage steps towards lower coal use (China) or are based on a range of different energy efficiency developments for a given rate of economic growth (India). The broken line for China (IEA 2013, New Policies Scenario) illustrates a possible demand trajectory based on Chinese policies to curb coal demand growth. The figure includes all types of coal, not adjusted for calorific content.

Source(s)

China demand (non-broken lines) based on the range spanned by US Energy Information Administration, 2013; IEA, 2013, Current Policies scenario; Feng, 2012; and Wood MacKenzie, 2013. India demand scenarios are based on the trajectories in the India Energy Security Scenarios (IESS) in Planning Commission, 2013. China production is based on an analysis of depletion trajectories of the ultimately recoverable domestic coal resource. India production numbers span the range considered in the Planning Commission’s IESS for future feasible extraction of domestic coal. 47

The rise in coal trade has also brought higher import prices, with scenarios in the range of US$85–140/t for the next two decades. Prices are now lower than five years ago, but twice the levels that prevailed historically. 48  The market has also become more volatile, and future prospects depend greatly on China’s and India’s import needs. Even at higher prices, coal-fired electricity will still be the cheapest near-term option in some countries, if other benefits of moving to other sources of electricity are not accounted for, especially in parts of Asia. Yet the cost gap to some alternatives is now smaller than ever – not least as renewable energy costs are in rapid decline. In many parts of the world, options such as hydropower, natural gas and wind are at or near levels where other concerns – air pollution, energy security, and climate – can tip the balance.

Air pollution – further discussed in the next section – is a major reason that the “true” cost of coal exceeds that of just generating the electricity. The need to address worsening air quality is changing the outlook for coal in many regions, as many countries set stringent pollution control requirements that raise costs. In the US, this has given natural gas an extra advantage, and in both the US and Europe, older and highly polluting coal plants have been replaced with alternatives. In China, where much of the coal-based infrastructure was built only recently, the prospect of having to retire some while it is still fully functional, in order to control air pollution, creates a significant conundrum. India and some other fast-growing countries could face similar dilemmas in the next 10–15 years – well within the lifetime of major energy investments now being made.


Coal mining and coal-fired power generation also can put pressure on water resources. Thermal power plants consume up to several thousand litres of water per MWh produced, but coal plants typically use more than gas plants, in some cases more than 10 times as much. Mining the coal can add hundreds of litres per MWh – on par with unconventional gas production, and an order of magnitude more than conventional natural gas extraction. Growing coal use can thus cause water stresses and compete with other water uses in regions with water shortages, which include many of today’s rapidly growing economies. 49  This has already been identified as a challenge to electricity supply growth in South Africa, and water shortages affect 70% of mines in China. 50

About US$750 billion was invested in new coal power plants in 2000–2010 alone, and those plants will emit around 100 gigatonnes of carbon dioxide.

From a climate perspective, meanwhile, major reductions in coal use are an essential feature of climate mitigation scenarios that limit global warming to safe levels. 51 At current production rates, proven coal reserves could last 100 years, and produce 1.6–2 trillion tonnes of CO2 emissions. 52 Coal is the most carbon-intensive of fossil fuels. In the power sector, coal accounts for 73% of emissions but only 41% of generated electricity. Once built, coal-fired power plants typically operate for decades, “locking in” their high emissions. Work for the Commission shows that about US$750 billion was invested in new coal power plants in 2000–2010 alone, and those plants will emit around 100 gigatonnes of carbon dioxide (GtCO2) if operated for 40 years. Those built in 2010-2020 will add a similar cumulative amount. 53  Any effort to reduce the energy sector’s climate impact therefore must include strategies to encourage energy supply options that can displace new coal infrastructure investments.

Shifting to a lower-risk trajectory

On the current course coal could account for 35–45% of global net growth in electricity generation over the next two decades, resulting in a 50-60% increase on current levels of coal consumption. Nearly all of the increase is projected in fast-growing regions of Asia, where coal could account for 50–70% of new power supply unless policies are changed. 54 In some countries that momentum is already shifting, however, and implementing policies already proposed (particularly in China) could significantly dent this growth – potentially to just half these levels – while effecting a 15% reduction in the OECD. 55 However, given the long lifetimes of the infrastructure involved, coal could still have a 35% share of global generation in the early 2030s (as noted, it is currently 41%).

These developments contrast with those required to limit global warming to 2°C. Many such scenarios see unabated coal-fired emissions falling to one-tenth of current levels by 2050, with significant near-term reductions. For example, the IEA 450 scenario sees coal-fired power generation falling to 60% of 2011 levels by 2030, even with the development of CCS, and total reductions in coal emissions of 11 Gt. 56 However, analysis carried out for the Commission suggests that as much as half of this reduction could be achieved at zero or very low net cost, once the changing cost of alternatives and reduced health damages and other co-benefits are taken into account. 57

A key step in shifting policies and investment choices away from coal is to ensure that the full implications of coal use are consistently accounted for. All of the factors discussed above have serious economic and health costs, often high enough to shift the cost-benefit balance in favour of alternatives. Given the known risks associated with coal, it is time to shift the “burden of proof”, so coal is no longer assumed to be an economically sound choice by default. Instead, governments should require that new coal construction be preceded by a full assessment showing that other options are infeasible, and the benefits of coal outweigh the full costs. Simply taking a full set of domestic policy concerns into account could lead to a much lower reliance on coal than many national decision-makers now take for granted. Such approaches are already being considered. For example, the European Bank for Reconstruction and Development (EBRD) is already developing a policy which would only fund coal-fired power generation in exceptional circumstances, and a simple quantitative methodology for assessing projects along dimensions of affordability, security and sustainability. 58

Nevertheless, new coal-fired capacity will continue to be built for some time, undermining efforts to keep climate risk at acceptable levels. From a climate perspective, there is therefore a strong case for developing CCS, and ensuring that new coal power plants either include CCS or can be easily retrofitted in the future. 59 Even with CCS at a large scale, coal use will have to be curbed. However, CCS is the only option that enables the continued use of coal while avoiding CO2 emissions. Significant progress has been made to develop CCS technology, but it still has a long way to go before it can be counted on as solution. Near-term action is thus needed to make CCS a significant contributor to climate risk mitigation (see Box 2).

Box 2 — What would it take to develop carbon capture and storage at scale?

CCS offers the potential to capture CO2 emissions from power plants and large industrial facilities and prevent their release to the atmosphere. It thus provides the option to reduce CO2 emissions while continuing to use some fossil fuels.

From a climate mitigation perspective, CCS could be highly valuable. Many scenarios to limit global warming to 2°C rely on some level of CCS deployment. Although no assessments suggest that CCS could capture all or most of current CO2 emissions or allow a continuation of current trends in fossil fuel use, the cost of achieving a low-carbon energy system could be significantly higher without the availability of CCS. 60 In several industrial sectors there are currently no other options for deep emissions cuts.

The development of CCS can build on significant technology progress, and most component technologies are in place, as CCS is already a proven technology in the upstream petroleum sector, and some trials and demonstration projects are under way in other sectors. In the power sector, however, CCS is only starting to be demonstrated: there have been several successful small-scale pilot projects, but the first two full-scale demonstration projects for coal-fired power plants are scheduled to start only in 2014. 61

Overall, however, CCS development and deployment are not where they need to be to significantly reduce climate risk. For example, for CCS to fulfill its role in climate mitigation,62 the IEA’s 2013 CCS technology roadmap envisages 30 large-scale projects by 2020, capturing and storing 50 million tonnes (Mt) of CO2 per year. 63 At present, 12 projects are operating, capturing about 25 Mt per year, but only four carry out monitoring consistent with long-term storage. Nine additional confirmed projects under construction would increase the total to about 40 Mt per year captured in 2020, though many projects would use the CO2 for enhanced oil recovery (EOR), 64  which to date has usually not involved monitoring to ensure long-term storage. 65

The picture for investment is more challenging still; In the IEA’s 2°C Scenario (2DS), the annual investment rate in CCS-equipped facilities would reach almost US$30 billion/year in 2020, with cumulative investment reaching more than US$100 billion, 66 while actual investment in 2007–2012 averaged only US$2 billion per year. 67 Full-scale deployment and construction of supporting infrastructure after 2020 would require further rapid escalation, with more than 2,000 Mt per year captured and stored in 2030, and more than 7,000 Mt per year by 2050. By 2050, a cumulative US$3.6 trillion would need to be invested. 68 While there are many other ways to reduce emissions to levels compatible with the 2°C target, it is clear that efforts must be stepped up if CCS is to play a major role.

Future CCS use also would need support through long-term mechanisms to create demand, underpin investment in infrastructure, and enable the development of new business models for the scaling of the technology. Unlike many other mitigation options, such as renewable energy or energy efficiency, CCS lacks intrinsic value beyond greenhouse gas mitigation, except for niche applications such as Enhanced Oil Recovery (EOR). Although some other commercial uses of CO2 are under development, 69 they face the challenges of CO2’s low value, low energy content, and the sheer volume that would need to be absorbed to make a real climate impact. EOR and other forms of CO2 use may nevertheless help improve the economics of demonstration projects and initial scale-up.

Long-term demand therefore would likely need to be driven by stable climate policy. This could take the form of a subsidy such as a feed-in tariff or quota, but ultimately, a long-term carbon price would be more cost-effective. The cost and level of support required cannot be judged with certainty prior to demonstration at scale. In the power sector, estimates have ranged around US$25-100 per tonne CO2 using current technologies. 70 In addition, there is a need to resolve legal uncertainties and to make the technology acceptable to the public, as concerns (including the risk of CO2 leakage) have held back some past projects.

The next steps required are clear; if governments want to make the option of CCS available, a rapid scaling of CCS demonstration is the first place to start, but early long-term commitment to climate mitigation also will be a prerequisite.

Air pollution as a driver of energy system transformation

Pollution from energy use accounts for as much as 5% of the global burden of disease.

The air pollution arising from energy use has multiple and severe impacts, and the increasingly urgent need to reduce it is driving everything from clean cookstove initiatives, to tighter vehicle emission standards, to shifts in power production and industry. 71

Pollution from energy use accounts for as much as 5% of the global burden of disease. 72 Air pollution is also linked to an estimated 7 million premature deaths each year, including 4.3 million due to indoor air pollution, mostly from cooking and heating with solid fuels. 73 Crop yields also are affected, with ground-level ozone reducing the yield of four major staple crops by 3–16% globally, particularly in South and East Asia. 74

Valuing these impacts in monetary terms is not straightforward, but existing estimates suggest very high costs, often exceeding the cost of shifting to other energy sources that would also significantly reduce CO2 emissions. Recent climate mitigation scenarios have estimated global average health co-benefits at US$50 to more than US$200 per tonne of CO2 avoided, relative to baseline development. 75 Translated into energy costs, these numbers have a dramatic impact on the relative attractiveness of lower-carbon technologies. For example, coal-fired power enjoys a financial advantage in large parts of Southeast Asia, at costs of US$60–70 per MWh. But accounting for air pollution even at the bottom of the range of avoided damages in 2030 (US$48/tCO2) adds a cost of US$40/MWh, enough to bridge or exceed the cost gap to alternative sources of electric power. 76 Even with pollution controls, coal plants in the top 20 CO2-emitting countries cause global average damages valued as high as US$49/MWh of electricity, although with wide variation (higher as well as lower) between countries. 77 Impacts rise even further if the upstream impact of coal mining, transport and processing are included; one estimate for 2005 put the total life-cycle “true” cost of coal in the United States as high as $150/MWh, 78 although emissions have since fallen. For comparison, the cost of electricity production from new coal plants in the US is around US$100/MWh. 79 Actual impacts may go further still. For example, it is likely that heavy pollution affects cities’ attractiveness to talent, and thus their capacity to be longer-term engines of economic growth (see Chapter 2: Cities).

There is significant variation and uncertainty in monetised estimates of the cost of coal-fired power. Still, the overall evidence is clear that continuing to make energy decisions without accounting for these factors leads to pathways with significant health damages, in many cases entailing costs that exceed the cost of switching to lower-polluting alternatives. Rational economic policy would include such costs when comparing energy options.

Many countries have raised air quality standards and tightened regulations as their populations demanded it. In Europe and the United States, air pollution has been reduced significantly, and improvements continue. For example, the damage caused by electricity generation in the EU is half what it was in 1990. 80 As noted above, tighter air pollution controls have also led older coal-fired plants to close and discouraged new construction. In the United States, only 5% of new capacity since 2000 has come from new coal plants. 81

Now it’s China’s turn to wage these battles. Many Chinese cities, especially in the north, have severe air pollution, with annual particulate-matter (PM10) 82 levels five to seven times the World Health Organization (WHO) guideline level, and average annual sulphur dioxide (SO2) levels that are triple the WHO 24-hour guideline level. 83 Notably, even requiring coal power plants to install flue-gas desulphurisation systems only slightly reduced SO2 emissions, because rising coal use in industry mostly offset the benefits. 84

China must find a more even balance of energy sources, but it also needs to restructure overall economic activity towards less energy-intensive activities.

Mortality from air pollution in China is now valued at 10% of GDP.85 The pollution has caused severe health effects and growing public concern, pushing the issue to the top of China’s political agenda – most notably through the Chinese government’s new “war on pollution”.

The task at hand is enormous. China’s air pollution problem is due to multiple factors: high population density, geographically concentrated energy consumption, a highly energy-intensive economy, and heavy reliance on coal across sectors. Modelling carried out for the Commission indicates that solving the problem will require not only “end-of-pipe” technologies to control pollution, but a far-reaching and accelerated transition for the entire energy system. Coal use in particular must substantially decline, with major implications both for power production and for industry. 86

China thus must find a more even balance of energy sources, but it also needs to restructure overall economic activity towards less energy-intensive activities. Notably, the new air quality targets are driven not only by concerns about air pollution, but also by dwindling profit margins, runaway energy demands in China’s heavy manufacturing sector, and by concerns about energy security, given the growing need for coal imports unless the current trajectory of coal increase is broken. Political leaders also increasingly recognise the multiple potential benefits of a cleaner development pathway, with more innovation, and more value-added services and differentiated manufacturing. All these factors together are creating strong pressures for change. 87

These dilemmas in China have direct implications for other countries. India, in particular, also has unusually high levels of coal dependence, high population density, and rapidly growing energy demand, as well as severe air pollution in many cities. Investments in the next few years could exacerbate and lock-in all these problems. Energy use needs to increase, but the near-term cost advantage of polluting options needs to be balanced against the risk that expensive corrective action will be needed in the future to reduce pollution. Judging by China’s case, such corrections may well be necessary well within the lifetime of energy infrastructure that is now being built, which in turn affects its relative economics vis-à-vis lower-polluting alternatives. On the brighter side, as we discuss next, many renewable energy options are now much more economically viable than they were when China and other countries built out their power infrastructure.

Box 3

Air pollution control in the Beijing-Tianjin-Hebei region of China 88

In the Beijing-Tianjin-Hebei region (also called JingJinJi) has been targeted by the central government for stringent air pollution reductions, including a 25% cut in ambient PM2.5 concentrations by 2017 on 2012 levels. The region’s air pollution is in large part linked to extensive coal use, including for power generation, heating, and heavy industry; Hebei province alone produced one-eighth of the world’s steel in 2012.

In response, Beijing, Tianjin and Hebei have jointly agreed to reduce coal consumption by 62 million tonnes from 2012 levels. Key measures include eliminating coal-fired power generation and renovating the residential heating infrastructure in Beijing, as well as drastic industrial restructuring in Hebei province, where a quarter of iron and steel and half of cement production capacity is to be phased out by 2017.

While air quality is undoubtedly a major problem, threatening not just health but also economic development, the air quality programme also seeks to reap multiple potential benefits from a cleaner development pathway. These include addressing the dwindling profit margins and runaway energy demands in the region’s oversized heavy industry, through innovation and restructuring towards more value-added production.

The planned actions will entail massive investment, the sacrifice of considerable sunk costs, and difficult political trade-offs. Industrial restructuring will pose formidable economic and social dilemmas, especially for areas such as Hebei province, with its high development pressure and limited financial resources. 89

Although impressive, there are indications that the planned measures will shift energy use and pollution loads to other parts of China, rather than reducing them altogether; for example plans to scale up coal-to-gas production and coal-fired generation capacity in western areas. 90. Not only would this reduce the potential for multiple benefits but also add a considerable pollution burden to other regions and do nothing to stem the increase of China’s total carbon emissions. Furthermore, although ambitious, the planned measures would still be insufficient to meet basic air quality standards.

A new era for renewable energy sources

Renewable energy sources have emerged with stunning and unexpected speed as large-scale, and increasingly economically viable, alternatives to fossil fuels. 91 These technologies have existed for decades, but until recently, only hydropower was used at large scale. 92 That is changing rapidly: while in 1996–2001, just 7% of the increase in electricity production came from renewable sources. In 2006–2011, 27% did, even as total power production grew almost twice as fast. 93 Much of this growth involved hydropower, the main electricity source in more than 20 countries. Yet new renewables, in particular solar and wind power, have also emerged as large-scale options.

This has created a sea-change in expectations. While a decade ago, most analysts expected wind and solar power to remain marginal for decades to come, they now are seen as key contributors to future global electricity needs. For illustration, the IEA’s central scenario (New Policies) envisions solar and wind combined adding more electricity production than either coal or gas until 2035. 94 All energy projections are very uncertain, and in the past those for the role of renewables have rapidly been outdated as policies and technologies changed at a fast pace. 95 Yet it is clear that, for countries seeking cleaner, more secure energy systems, the new viability of renewable energy has opened up an enormous opportunity to diversify and expand domestic energy production.


A fast-changing cost profile

The key reason that renewable energy can now play a major role is that costs have fallen very fast. In 1990, wind power was 3–4 times more expensive than fossil fuel electricity, making it infeasible at scale. 96 Since then costs have dropped by half or more while performance has increased dramatically. Improvements have been driven in part by the willingness in some countries to build out wind while costs were still high. In places as diverse as Australia, Brazil, Mexico, South Africa, Turkey, and several US states, the cost of electricity production from onshore wind power now is on par with or lower than fossil fuel alternatives. In Brazil, wind power has been the cheapest source of new power in recent auctions for new electricity contracts. South Africa similarly has seen wind power procured at costs as much as 30% below those of new coal-fired power. 97 Wind power remains more expensive in places where wind resource is poor, fossil fuels are cheap, or where financing or other costs are high, and in offshore installations. As discussed below, larger volumes of wind power also need to account for costs of grid integration. However, in large parts of the world, it is now a fully economically viable source of incremental power supply.

Solar PV power remains costlier, but is now half the cost it was just in 2010, 98 as module prices have fallen 80% since 2008.99 The world’s largest, unsubsidised solar PV plant was contracted in 2013 in Chile: 70 MW in the Atacama Desert. 100 At least 53 solar PV plants over 50 MW were operating by early 2014, in at least 13 countries, and several planned projects are now considered competitive without subsidies. 101 Rooftop solar for homes is also competitive with retail electricity prices in several countries, including Australia, Brazil, Denmark, Germany and Italy. Even at high financing rates, solar PV is now cheaper than diesel generators, often the main alternative in rural areas in developing countries where grid connections are unavailable or cost-prohibitive. 102

Figure 4

Indicative levelised costs of solar PV electricity over time, and estimated lowest utility-scale cost to date, compared to a global reference level for coal and natural gas.

Notes

Solar PV costs can vary by ~50% or more up or down depending on solar resource and local non-technology costs, and even more with variations in capital and financing costs. Assuming 9.25% WACC, 17% capacity factor for solar PV, US$70/t coal price and US$10/MMBtu natural gas price. The estimated lowest 2014 utility-scale cost is based on a recent power purchasing agreement by Austin Energy, Texas (adjusted for subsidies).

Source(s)

Historical solar PV costs: Channell et al., 2012, and Nemet, 2006; illustrative fossil fuel range based on US LCOE for conventional coal from US EIA, 2014 (upper range) and capital cost assumptions from IEA, 2014 (lower range). 104

Other options are growing in prominence as well, such as geothermal energy, modern bioenergy (using residues from agriculture and forestry, among other fuels), and energy from waste. The use of solar thermal systems for heat is growing rapidly, with China as the global leader; some countries, such as Brazil and Morocco, are installing solar water heaters in low-income housing. 105 At the same time, hydropower continues to be developed at large scales around the world, and in poor countries from Bhutan to Ethiopia, it is dramatically improving energy access and economic opportunities. (See Box 4 for a discussion of hydropower and nuclear.)

The rapid cost reductions have allowed renewables to continue to grow even as investment has slowed; in 2013, adding the same total non-hydro capacity as in 2011 required 23% less capital. 106 New solar PV capacity was one-third higher in 2013 than in 2012, despite 22% lower investments. 107

Detailed analyses indicate that cost reductions and performance improvements can continue for many years. For example, the technologies to cut the cost of producing solar PV modules by another half are already developed. 108 Further cost reductions will depend on active R&D, which also is increasing in volume, albeit that higher levels are needed for a range of energy technologies (see Chapter 7: Innovation for a discussion of innovation requirements in energy). They also will depend on continued deployment, which has proven critical in enabling the cost reductions that have taken place to date.

Growing interest in renewables

While continued cost reductions strengthen the case, there already are compelling reasons for countries to invest in renewable energy. As noted above, developing renewables can strengthen energy security, reducing dependence on fossil fuels and exposure to global market volatility. Virtually all countries have renewable energy sources of some type that they can exploit.109 The technical potential for renewable energy is far greater than current human energy use, and studies suggest it could supply 95% of global energy demand by 2050, 110 and double its current share by 2030, at a relatively low net cost. 111 Apart from biomass, renewable energy also has negligible air pollution impacts and few or no CO2 emissions. And except for geothermal and large hydropower, new capacity can be built quickly and at a wide range of scales.

80% of Germany’s new generating capacity in the last decade came from renewables.

Many countries have recognised these potential benefits and adopted policies to stimulate renewable energy growth. More than 140 nations had some form of renewable energy target as of early 2014. 112 Germany has been a pioneer: 80% of its new generating capacity in the last decade came from renewables (50% from solar and wind), with significant resources expended on early deployment when costs were still high to drive technologies towards commercial viability. Spain, Portugal, and Denmark have expanded wind power to more than 20% of electricity over the past decade.

Fast-growing nations are also pursuing renewables. In China, the share of coal power in new electricity generation, 85% in the last decade, dropped to just over 50% in 2013, while 15% came from solar and wind and 30% from hydropower. In 2013 China accounted for 21% of all global renewable investment, 113 adding more than five times more wind and nearly twice as much solar as any other country. 114 Chile doubled its target for renewable electricity to 20% in 2013, seeking affordable, rapidly scalable ways to reduce its dependence on gas imports and on drought-vulnerable hydropower. 115 And as of 2013, almost half of African nations had done national assessments of renewable resources; 116 Ethiopia, best known for its ambitious development of hydropower, also has Africa’s largest wind farm and is pursuing geothermal energy, as well as biofuels and off-grid renewable solutions. 117

Still, both current and likely future renewable energy growth vary greatly across countries. In high-income regions that have prioritised renewable energy, it already contributes 5–25% of total electricity generation (wind, solar and bioenergy, or 10-70% including hydropower). 118 Scenarios also suggest that in those countries, a majority of new electricity generation to 2030 (50–100%) will come from renewables, based on improved economics and existing policies. 119 Many countries have announced policies that would further increase deployment, which could result in renewables providing all new net generation capacity additions in those countries. Overall, depending on the extent to which policies that have already been announced are in fact carried through, non-hydro renewable energy thus could grow to 15%–25% of total generation by 2030 in high-income regions, and higher still for ambitious individual countries.

Fast-growing economies could not realistically achieve such high shares of non-hydro renewables by 2030, given much faster demand growth. In Asia, these sources currently provide only 1–5% of electricity. Scenarios suggest they could account for 10–20% of net growth in electricity supply. The picture is similar in middle-income countries elsewhere. In individual countries, however, large hydro resources can drive the total share of renewables as high as 80–90% of electricity in individual countries.

Yet there is potential for more growth. Countries have often underestimated how quickly renewable energy sources would become more affordable and the contribution they could make to energy and economic objectives. Although national circumstances vary, the evidence suggests that most high-income countries could ensure that renewables (including hydropower where available) could grow to cover all new net demand for electricity to 2030. They could also displace 20% or more of coal-fired generation by not extending plants’ lives or closing the most polluting and inefficient units (targets in the EU already go beyond this). Similarly, middle-income countries that now depend heavily on coal could aim to have non-hydro renewables provide 25–30% of net new electricity supply without resorting to high-cost options – higher still for those with particularly good resources and technical capabilities. Additional hydropower growth should also be pursued, where local resources and sustainability concerns allow it. The benefits of reduced lock-in to air pollution and possibly volatile fuel costs mean that such increased ambitions could often be met at low incremental cost.

Overall, the Commission finds, renewable energy is already well positioned to become a mainstay of energy policy – and in some countries, of development more broadly. Yet real barriers remain – some systemic, and some specific to solar and wind power. Below we discuss the biggest issues and potential policy measures to address them.

Box 4

Nuclear and hydropower: Two proven low-carbon technologies

Both hydropower and nuclear power are well-established energy sources with low local emissions as well as low GHG profiles. While solar and wind power have grabbed the spotlight in recent years, hydropower and nuclear power are still by far the biggest non-fossil sources of electricity, at 16% and 12% of global generation, respectively. 120 Both offer nearly emissions-free energy, with very low marginal costs, and have a proven record at large scales. However, they are also highly capital-intensive, can take a decade or more to plan and build, and come with a range of environmental and social risks.

Hydropower provides clean power that can be ramped up and down quickly, with minimal losses. Its flexibility and storage capacity make it useful in many settings, and it can be a good complement to renewable sources with variable output, such as solar and wind. There is also great untapped potential: current generation is 3,200 terawatt-hours (TWh) per year, but another 1.5 times that could be added at costs not exceeding those of fossil alternatives. These attractive features continue to drive hydropower development, with growing economies in Asia and Latin America adding the equivalent of 3% of existing global capacity per year. 121

Yet hydropower can also have serious social and environmental impacts. Building dams and reservoirs may displace communities and widely disrupt ecosystems, and can also be contentious when downstream water supplies are disrupted. In addition, reservoirs can be significant sources of methane, a potent greenhouse gas; the GHG emissions of 25% of reservoirs are one-quarter or more of those of an equivalent coal plant. 122

Nuclear power provides 20% of electricity in OECD countries, having expanded rapidly from the late 1960s to the late 1980s. 123 Its advantages have included stable electricity supply with very low fuel costs, as well as good environmental characteristics if accidents and leaks of radioactive material are avoided. The ability to provide zero-carbon energy has since been added to its list of advantages. However, nuclear power also raises concerns about how to handle radioactive waste, proliferation risks, and severe worst-case accident scenarios. Public support was severely eroded by the Three Mile Island accident in 1979, and then the Chernobyl and Fukushima accidents. Increasingly stringent safety standards and a limited number of approved suppliers have increased construction costs in OECD countries three to seven fold since the early 1990s. 124 Projects now under way in Europe are reaching historic highs in terms of delay and cost escalation.

As a result, deployment of new nuclear capacity has slowed to a crawl, with less than 15% cumulative growth since 1995. 125 Several OECD countries have since announced plans to reduce or phase out nuclear power completely, a process that has firmed after the Fukushima accident in 2011. Nuclear power’s continued growth will likely depend on a small number of non-OECD countries, which are aiming to add capacity corresponding to a third of the current total by 2025, 70% of it in China. 126

Innovations such as small modular reactors and thorium fuel, spurred by increased deployment in non-OECD countries, may improve the outlook for nuclear energy. It does offer many benefits in terms of energy security and avoided emissions, but nuclear energy’s challenges – from waste handling, to high capital costs, to public concerns, are likely to persist.

Overcoming barriers to large-scale deployment

The most salient barrier is cost. Renewable energy can already compete with fossil fuels where resources and supply chains are favourable and low-cost finance is available. As noted, many countries can exploit such opportunities. In most of the world, however, new renewables at larger scale will still require public support – which, in turn, creates political trade-offs, especially when budgets are tight. Done badly, subsidies also can distort markets and result in overpayment. Renewable energy subsidies have grown fast, to more than US$80 billion for electricity in 2012 (60% in the EU). 127 Much of this has been akin to an innovation down-payment, arising from early commitments to deploy technologies when they were still expensive in order to achieve further cost reductions improve performance. Thus, they are not a guide to what future subsidy levels will be needed. For example, achieving Germany’s solar PV build-out today would cost a third of what Germany spent over the past decade – and potentially much less in a country with better solar resource. 128

Assessments now suggest that support will continue to be needed for some time, but that the required support per unit of electricity is falling fast. For example, the IEA now envisions a six-fold increase in non-hydro renewables with just over twice the current subsidies. Other scenarios see renewables scaling faster still, and with lower subsidies. For example, the “REmap” assessment by the International Renewable Energy Agency (IRENA) identifies potential that would give 60% more generation from renewables than is realised in the IEA scenario, and would result in 44% share of renewables in electricity production by 2030. 129 Despite the higher volumes, the estimated subsidies are lower per unit, and the average increase in cost is US$20/MWh. 130 Other assessments have suggested that, by the 2020s, there will be no need for further subsidy of onshore wind and solar PV in Europe. 131

Where subsidies continue to be necessary, they are often on the same level as the monetary value of the multiple benefits of more diverse and less polluting energy supplies. For example, the IRENA assessment suggests that accounting for air pollution could reduce the true incremental cost to society by half or more.132 Likewise, the support required would be much lower in the presence of a carbon price.

Another value of deploying renewable energy now is that it helps drive down future costs – not just through global technology improvements, but by improving individual countries’ ability to make use of the technologies. Even for similar circumstances, the cost of solar and wind power can vary by a factor of two or three depending on the maturity of local industries, economies of scale, variation in the cost of financing, and the regulatory environment. 133 In other words, the “learning by doing” that helps drive costs down is not just about global technological progress, but also about developing local capacity. One key step in this regard is to ensure that renewables can access finance on terms at least as beneficial as those extended to conventional sources. Costs are now often 20% higher than they would be with financial solutions tailored to the characteristics of renewables rather than fossil fuels (see Chapter 6: Finance for a deep-dive on how improving investment conditions can reduce the cost of renewable power). Countries that want to avail themselves of renewables as they fall in price should thus build the local capacity to do so ahead of time.

Expanding the use of solar and wind power also depends on successfully integrating these technologies into the overall electricity system. Unlike gas, coal, nuclear or hydropower, wind and solar power production is variable and cannot be controlled or fully predicted in advance. Good resources are also can be located far from centres of demand, requiring new extensions of power grids. Integrating variable renewables thus requires much more active coordination and management. Much has been learnt in the last 10 years as mechanisms to accommodate high shares have been put in place in several countries, such as Spain, Ireland, Denmark, Germany, and some US states. A mix of supply- and demand-side options have been deployed, including flexible conventional generation, new transmission, more responsive demand, and changes in power system operations to maintain the same ability to reliably meet demand as a more traditional “baseload” system. This process has benefited from steady innovations in forecasting, grid planning, market design, and other solutions. 134

Very high levels of variable renewable power have not yet been attempted, but from a technical perspective, they look increasingly feasible. For example, a modelling 2014 study for a major US electricity market (PJM) concluded that 30% variable renewables could be integrated with modest additions of grid extensions and flexible gas-fired power plants. 135 Detailed modelling for the United States as a whole showed how an electricity system with 80% renewables would be feasible with technologies that are commercially available today.136 Costs were estimated at 8–22% above baseline developments, including all integration costs, but depending on the rate of continued technology development to reduce generation costs.

Most countries will not have variable renewable anywhere near these levels for a long period of time. For example, putting in place the full set of REmap options only four countries reach shares of variable renewables exceeding 30% by 2030, and most (including India and China) stay below 20%. 137 Starting from a low base, most countries could technically continue to build out variable renewables for many years before hitting levels where costs escalate.

Still, it is important to prepare. Failing to properly plan for the integration of variable renewables can drive up costs and complicate further expansion of wind or solar power even at modest levels of penetration. 138 Problems have ranged from unavailable network connections in Brazil, to strains on the grid from “hotspots” of production in India, or failure to provide incentives to enable fossil fuel plants to vary their output to complement varying wind or solar PV production in China, to failure to anticipate new grid requirements in Germany. Other examples show that many of these problems can be kept manageable with good policy, but integrating renewables clearly increases demands on coordination and institutional capacity. Additionally, countries need to bear in mind that the value (in terms of meeting power needs) of adding more generation with the same time-variability declines as shares increase; for example, solar PV might be very valuable initially as a way to manage peak load, but then have lower capacity value. An important guiding principle to address these issues is that renewables should not be managed separately, but should be built into the power system’s design and operation.

Further innovations will also be needed as renewables’ share of energy production grows. These may include new technologies (energy storage, smart grid management), but equally important new business models (e.g. for demand response and for the provision of other flexibility services), as well as new financing mechanisms, regulatory approaches, and market designs. Emerging experience in both Europe and the United States shows that the entry of renewables can prove very challenging to incumbent utilities, and create a need for new mechanisms to ensure that the fossil fuel-fired plants required for system stability can continue to operate in a situation of lower wholesale electricity prices and lower running hours caused by the entry of new renewable sources. A few pioneering countries are acting as laboratories to develop the full solution set, much like early support was crucial for driving down the cost of equipment. Continuing these investments in innovation will be critical to long-term success.

In addressing these barriers, the first step often will be conceptual: to adjust to the rapid pace of change and start evaluating plans that include much higher contributions for renewable energy than ever considered before. The starting point must be for all countries to evaluate an up-to-date and integrated candidate scenario where renewable energy provides a large share of new electricity production, set against a full suite of energy and other objectives. This, in turn, requires mapping the available resources, understanding additional grid requirements, accounting for future cost developments in both fossil and renewable energy, understanding the impact on energy security parameters, accounting for the value of avoided lock-in to higher-polluting forms of energy, and valuing the reduced exposure to volatile fuel prices. The results will differ, depending on local circumstances and priorities, but the evidence suggests that many countries will find renewable energy much more attractive than currently assumed by comparing project-level costs. Several proven measures can also help make renewables more cost-competitive (see Box 5).

Box 5

Reducing the cost of renewable energy deployment

Much has been learned about how to deploy renewable energy cost-effectively. Some level of financial support still is needed in most countries, and it should be minimised through best practice.

Achieve sufficient scale and efficient operation

Both the cost of developing and operating renewable energy projects vary by as much as 50% between locations. For example, the balance of system costs of solar PV in Germany are half those of the United States. 139 For wind power, maintenance costs and success in maximising production also vary sharply. Achieving sufficient scale and maturity of local supply chains as well as operational expertise are all elements in reducing the effective cost of electricity from new renewables. Ensuring sufficient competition between project developers can be a major driver for such improvement.

Mitigate risk and legacy barriers

In many parts of the world, power investment is generally held back by the risk that investments will not be recovered over time. This is amplified in the case of renewables, both because a larger share of the total cost has to be sunk upfront, and because the economic case often depends on government support mechanisms to a greater degree. Identifying and addressing regulatory and other barriers, and streamlining planning and approval requirements, is critical to reducing construction time and removing the risks that either raise the cost of capital or prevent financing altogether.

Improve the financing structures

Current investment structures for power generation typically are set up to serve projects with the cost structure of fossil energy, including a large share of ongoing costs and fossil fuel price risk. Adapting financing to the specific features of renewable energy can reduce financing costs, in turn reducing the total cost of renewable electricity production by as much as 20%. 140 The YieldCo solutions pioneered in the United States are an example of this. 141

Use flexible and efficient support mechanisms

With rapidly falling costs support levels risk being set too high. Countries are now increasingly turning to auction mechanisms to enable cost-effective use of support, and also building in automatic revisions of levels and relating support to underlying electricity prices. Done right, such improvements can be made without retroactive changes to arrangements or the introduction of other risk that is damaging investor confidence. In addition, where the objective is centred on greenhouse gas mitigation, renewables deployment should be backed by carbon prices. 142

Plan for grid integration

Ineffective planning for the integration of renewables to the power grid can increase cost substantially. Costs can be kept down even at substantial levels of renewables penetration through greater use of demand response, advance grid construction, increased balancing area size, improved forecasting of renewables output, or market design improvements such as shorter time windows for the planning of electricity production. Failures to adopt these can increase costs substantially. For example, China had to curtail as much as 10% of its wind power production last year due to insufficient grid connections. 143

Opportunities to expand energy access

The people with the most to gain from modern energy are those who still lack it. As noted earlier, 1.3 billion people have no access to electricity and 2.6 billion lack modern cooking facilities. More than 95% of this unmet need is in sub-Saharan African or developing Asia; 84% is in rural areas.144 Furthermore, in many urban and peri-urban areas in the developing world, large numbers of people have only partial or unreliable access to a grid connection.

Access to electricity allows households to have more productive hours, including time for children to study; with moderate rises in income, it also provides access to welfare- and productivity-enhancing electronics such as mobile telephones and refrigeration. 145 Reliable electricity access also improves business productivity, and provides access to telecommunications, which can facilitate growth in a range of development areas such as health care, institutional access, and political voice. Conversely, lack of access to electricity can impede a range of economic activities. 146

Overcoming energy poverty requires upgrading the quality and efficiency of household thermal energy.

In the past, electricity access has expanded both through urbanisation and through extension of centralised power grids. China, Thailand, and Vietnam recently achieved near-universal access through these routes, 147 and they will continue to be important to relieving energy poverty. However, in much of the world the process is slow and faces multiple barriers. Without new policies, the total number of people without access to modern energy in fact could increase rather than fall in the next two decades. 148 Overcoming energy poverty also requires upgrading the quality and efficiency of household thermal energy, primarily used for cooking. This has significant benefits by reducing or replacing the need for traditional biomass fuels such as wood and dung.149 Eliminating the need for fuel wood collection also liberates considerable time for other productive activities, especially for women and girls.

For electricity, there is growing agreement that renewables can complement traditional approaches to overcome barriers to expanded access. Falling costs, new business models, and technological innovations are making decentralised solutions increasingly attractive. For example, a recent IEA scenario for universal energy access by 2030 assumes 56% of the investment would go to “mini-grids” and off-grid solutions, with up to 90% using renewable energy sources. 150 In principle, these technologies are a good fit because they are modular and can be installed at small scales. Inexpensive low-carbon solutions are also emerging to meet specific needs, such as solar mobile-phone chargers and rooftop solar water heaters. Further, the distribution cost of access via grid expansion will be high in many cases. Distributed generation technologies can often provide electricity more cost-effectively in these cases, though care should be taken to ensure that the technologies employed do not imply a lock-in to perpetually low-power electricity consumption.

Renewable energy also can have long-term advantages. Providing universal basic energy access would not significantly increase greenhouse gas emissions, even if only fossil fuels were used. 151 But longer-term, energy use must move beyond basic services, scaling up to productive uses that support community development and income generation. Low-carbon alternatives can therefore be more attractive where the potential future scale of CO2 emissions, air pollution, and fuel cost and availability is a concern. Conversely, those alternatives will only be viable if they can scale up and fit into a future with the full range of modern energy services.

As with renewables more generally, the Commission’s research suggests that effective policies and institutions are vital to the success of low-carbon options for expanding energy access. While the political momentum around expanding energy access and mitigating climate change has been high in recent years, few, if any, countries have aggressively pursued both goals at once. Consultations with policy actors in Africa (see Box 6) suggest that there is a great unmet need for evidence about the feasibility and benefits of low-carbon options; without it, even governments that vocally support climate action will tend to stick with conventional technologies and fossil fuels. Overcoming this inertia will require demonstrating how a low-carbon path can advance not only climate or energy goals, but broader social and economic well-being. There is also a need to understand how off-grid low-carbon technologies take hold “on the ground”, and what it takes to build sustainable business models.

Overall, this calls for much accelerated experimentation and demonstration. This needs to go beyond just technologies, and include business models, financing arrangements, and policy environments. Cooperation in other areas, such as the CGIAR model 152 for agricultural applications, can offer lessons here on how to pursue context-specific innovation in a structure of regional hubs and a distributed institutional structure.

Two other key barriers need to be overcome as well: First, access to finance remains limited, hindering the scale-up of low-carbon solutions. Since upfront capital costs are often higher than for conventional options, the risks of investments are notable, and banks are reluctant to offer loans. Overcoming this for utility-scale technologies requires targeted, long-term funding schemes, including a robust and supportive institutional framework on the national level. For distributed energy technologies, it requires business financing products, such as seed capital and working capital, to allow companies offering consumer and commercial energy products to develop and reach the market. There could be significant value from a business incubator approach to underpin the innovation framework mooted above.

Second, while the private sector has a key role to play in bringing low-cost renewable solutions to the market, many businesses struggle to generate revenues and be sustainable over time. Capacity- and skills-building – not just in the technologies, but in business and market development – will be essential.

Box 6 — Low-carbon options for energy access: African perspectives

In order to better understand how low-carbon options are contributing to energy access expansion, the Global Commission convened a workshop in Nairobi, Kenya, in April 2014 with policy-makers, business and nongovernment organisation (NGO) representatives, and academic experts from across Africa.153 A key insight from that workshop was that low-carbon options have not (yet) altered the fundamental barriers to expanding modern energy access in the region, including high costs to supply rural households; weak implementing capacity; lack of reliable financing, and low demand and ability to pay on the side of consumers. Participants also noted the wide range of low-carbon options being pushed by different interests, and a lack of evidence for policy-makers to evaluate the suitability of those options.

Morocco was cited as a prime example of successful use of low-carbon options to expand energy access. The country is a net energy importer and heavily dependent on oil, which accounted for 62% of its primary energy consumption in 2011. Its geography also gives it one of the highest potentials for wind and solar in the world. To seize that potential and improve its energy security, Morocco has put in place consistent policy support, including favourable financing options and regulatory frameworks, to support the deployment of renewable energy solutions. Today, about 15% of the population gets energy from a low-carbon source. The impact has been particularly great in rural areas, where the electrification rate increased from 18% to 98% between 1995 and 2012, first through a grid expansion programme and then through off-grid solar PV where grid expansion was uneconomical.

Morocco’s success is credited to several factors:

  1. strong political commitment to universal energy access, backed by appropriate institutions and incentive schemes for participation;
  2. strong financial support, drawing on multiple sources, including a clearly defined programme that attracted international funds, targeted subsidies from the national utilities, and a solidarity tax of 2% paid by all households connected to the grid;
  3. a strong public-private partnership designed to deliver power to rural customers at costs comparable to what grid-connected households pay;
  4. extensive piloting programmes that gathered detailed data to fully understand the preferences and needs of the end-users, including their willingness to accept the new technology.

The workshop also highlighted several other cases where off-grid, low-carbon technologies have successfully filled a niche, such as the widespread use of rooftop solar water heaters in South Africa, which has also been supported by the government. Some private-sector initiatives have also done well, such as solar-powered mobile phone chargers – individual kits or village charging stations – which are spreading across sub-Saharan Africa, meeting both energy and communications needs.

The success stories highlight the need for sustainable business models, and workshop participants also said that building market-development capacity is a key gap to fill in technology-transfer efforts. Several participants also noted that African countries can learn a great deal from one another, by comparing their energy-access strategies and the ways in which they are using enabling policies, institutions and investments to support the deployment of low-carbon technologies.

Natural gas as a potential “bridge” to low-carbon energy systems

Natural gas has become a preferred fuel in much of the world. Outside a handful of coal-intensive countries, it has provided 60% new energy since 1990, and almost 80% outside transport – increasing its share across electricity generation, heating of buildings, and industrial uses. 154 The versatility of the fuel across a number of end-use sectors is complemented by its ability to reduce local air pollution where it displaces coal. It also has been a major factor in reducing GHG emissions in some countries, including the United Kingdom and Germany in the 1990s, and the United States recently. In electricity production in particular it has been discussed as a potential “bridge technology” in the transition to a lower-carbon economy: 155 electricity produced from natural gas can emit just half the CO2 as the same amount of electricity from coal, and natural gas has a proven track-record of scaling rapidly where supply is available. At best, turning to natural gas therefore could help avoid new coal construction and even dislodge the preference for coal as the default new option for new power supply. In addition to reducing CO2 emissions directly, the flexibility of gas in electricity generation makes it a potentially important enabler of higher levels of penetration of variable renewable energy sources.

Electricity produced from natural gas can emit just half the CO2 as the same amount of electricity from coal.

The expansion of natural gas would be greater still if key challenges were overcome. Natural gas is difficult to transport; the end-to-end cost of transporting liquefied natural gas (the only option where pipelines cannot be built) can be substantial and has been increasing sharply over the last decade as the cost of capital intensive infrastructure has escalated and demand increased. Outside the US, natural gas has also become less cost-competitive, quadrupling in price since 1990 while coal doubled. 156 Energy security is a concern as well, with regional dependence on single large suppliers, and global reserves concentrated in just five countries. For these and other reasons, less than a third of natural gas is internationally traded. 157 In particular, natural gas has made barely made a mark in India and China, where supplies have not been available on terms deemed acceptable.

Shale-gas production has drawn considerable attention as a potential way to overcome these challenges. In the United States, the availability of shale-gas supplies has resulted in a 60% drop in gas prices, a 20% reduction in coal used for electricity generation, and a consequent reduction in national GHG emissions. 158 It even offers the prospect of substantial gas exports. A key question is whether this phenomenon can endure and spread more globally, delivering wider benefits to the economy and climate and make the “bridge” role for gas more likely.

Can greater natural gas supplies be a game-changer? 159

A number of assessments suggest that the potential natural gas supply is large. Although there is uncertainty about the realistically recoverable reserves from unconventional gas deposits, by some estimates it could provide as much as two-thirds of incremental gas supply over the next two decades. By 2035, the IEA has suggested that China in principle could produce nearly 400 billion cubic metres per year of unconventional gas, as much as the US produces today and 10 times the amount China recently agreed to import from Russia after 10 years of negotiation. 160 In India, production could climb to nearly one-quarter this level. Furthermore, greater globalisation of gas markets through expanded liquefied natural gas (LNG) and pipeline infrastructure would allow abundant, low-cost conventional and unconventional gas resources to reach supply-constrained markets, including those where much of the world’s new coal plants could otherwise be built. Such developments would make it likelier that gas could play an important “bridging” role.

Such a scenario is far from certain, however. Not only is the technical potential highly uncertain, but several factors could get in the way. Developing new supplies is capital-intensive and involves long lead times, and at the current rates of development, it may not be possible to increase the supply fast enough to meet substantial new demand. Producers will also need to address social and environmental concerns related to production practices, particularly those associated with hydraulic fracturing (“fracking”).

Will natural gas growth benefit the climate? 161

Moreover, the climate implications of a high-gas scenario are far from straightforward. It matters where low-cost gas becomes available; the benefits will be greatest in regions that would otherwise depend on coal, and greater if natural gas is used for electricity production than for heating and transport applications. Also, if natural gas operations are not well managed, methane emissions from venting and leaks in production and transport can partly offset and even negate the GHG advantages of natural gas (see box). In fact, research for the Commission indicates that natural gas is likely to provide net climate benefits only if it is backed by robust climate policy and environmental regulations, for two key reasons.

First, in the key regions of Asia that now depend on coal, gas – especially imported LNG – is likely to remain more expensive, suggesting that it will be difficult for gas to compete on market price alone, and giving it a very limited role in electricity production in particular. Policies to reflect social and environmental costs, as the US, China and others have pursued, will thus be essential for gas use to increase.

Second, without carbon pricing or other emissions constraints, cheap and abundant natural gas supplies could both increase energy demand and displace lower-carbon options that would otherwise be used. The high initial investment and long life of gas infrastructure also amplify the risk of “locking out” zero-carbon options including renewable and nuclear energy. Meanwhile, coal that is displaced in one geography can be internationally traded, a phenomenon that already has reduced the global GHG emissions reductions resulting from increased gas use in the United States. Several modelling exercises suggest that these factors combined could be enough to negate GHG emissions benefits from displacing coal and oil use in a high-gas scenario.

In other words, policy-makers cannot count on abundant natural gas, on its own, to serve as a “bridge” fuel, nor should they promote gas as a climate solution without strong supporting policies. Active interventions, such as attributing to coal its full social cost, regulating gas production practices to limit fugitive methane emissions (see Box 7), putting a price on carbon emissions, and supporting low-carbon technologies so their development and deployment are not slowed down, will be needed for gas to fulfil this role. Fortunately, such interventions have other societal benefits as well. Making gas a viable “bridge” therefore could be a component part of a general approach to enabling better energy supply, even if it cannot be counted on as a solution on its own.

Box 7

Reducing methane emissions

The release of methane from energy production is a major source of GHG emissions. Recent estimates put the total released from energy activities in 2010 at around 125–129 million tonnes of methane per year (4.2–4.4 billion tonnes of CO2 equivalents), with 80–90 Mt from oil and gas supply and distribution (2.7–3.1 Gt CO2e). 162 For comparison, this is the equivalent of 16–18% of the 17 Gt CO2 emitted from oil and gas combustion in 2010. However, although estimates tend to be close to one another, data are in fact very poor. Actual emissions levels could in fact be much higher. For example, estimates of leakage from natural gas systems range as widely as 1–5% of total gas produced, with individual studies identifying still higher numbers. 163

A number of assessments suggest that reducing methane emissions could be economically attractive and offer co-benefits through reduced air pollution, as well as substantial climate benefits. For example, the US Environmental Protection Agency has estimated that methane emissions from oil and gas systems could be reduced by 35% by 2030, or 880 Mt CO2e, at no net cost once the value of the gas is taken into account. 164 More near-term, the IEA has identified measures in upstream activities could achieve 580 Mt CO2e of emissions cuts by 2020, as part of a set of GDP-neutral measures to reduce GHG emissions. 165 Other detailed assessments for individual countries similarly show substantial reductions available at negative or low cost. 166 As methane also has adverse impacts on human health and crop yields through its contribution to the formation of ozone, reductions of fugitive emissions also would have other co-benefits. 167 Moreover, reducing methane emissions from natural gas systems, and unconventional gas production in particular, may be a prerequisite to enable a “bridge” function of natural gas in a transition to a low-carbon energy system. 168

Achieving these reductions would require a combination of better measurement and monitoring to understand the scale of fugitive emissions; increased industry awareness and commitment to options to effect reductions; and sharper incentives to change practices and underpin long-term investment programmes. Some of these may be achievable through voluntary industry initiatives, notably in raising awareness and improving monitoring. Others may require regulation, including increased enforcement of existing regulations (e.g. to reduce flaring of gas) and new regulations to set standards across oil and gas supply chains.

Making the most of our energy supply

A final, huge opportunity – also seen as crucial by the IEA – is the potential to improve energy productivity: the value created per unit of energy input. Countries at all income levels have made great strides in recent decades, with the biggest progress in fast-growing economies: China, for example, improved by as much as 6% per year for some time. But even mature economies have seen steady improvements near 2% per year. However, some countries have made little progress, and in a few – most notably in the Middle East, where energy prices are heavily subsidised – energy productivity has in fact worsened. 169

Getting on track to maximise energy productivity has direct implications for energy demand. Businesses and households do not need energy for its own sake, but rather for the energy services it provides: mobility, heat, lighting, mechanical power, etc. Energy efficiency has steadily improved over the past four decades; without those improvements, energy supplies would have had to grow far more rapidly, magnifying the associated expense and disadvantages (see exhibit). More likely, countries would have had to accept much lower levels of benefits from energy use. It is often overlooked that increased energy efficiency can be the primary mechanism by which countries expand their benefits from energy use over time.

Figure 5

Impact of energy efficiency on energy consumption in 11 countries, 1974–2010

Notes

The figure shows the actual increase in annual final energy consumption, and the energy that would have been needed without energy efficiency improvements. Energy services doubled, but energy use went up by only 20%. The countries surveyed are Australia, Denmark, Finland, France, Germany, Italy, Japan, the Netherlands, Sweden, UK, and US Energy efficiency was four times more important than any actual fuel source for enabling growth in energy services.

Source(s)

Source: IEA, 2013. 171

Still, much greater potential exists, at all levels of development: from improved biomass cookstoves, to gains from electrification, to specific opportunities in a wide range of uses across modern economies. Buildings offer particularly large potential, especially with heating and cooling but also with lighting and other energy services. Baseline scenarios project a doubling or tripling of energy demand from buildings; but more efficient technologies are already available that could provide the same energy services to users with barely any increase in energy demand. In the transport sector, energy efficiency and vehicle performance improvements range from 30–50% relative to 2010 depending on mode and vehicle type. 172 Industrial energy use, meanwhile, has stronger mechanisms for ensuring energy use is efficient, but even here a scenario with the global application of best-available technology could reduce energy use by 25%. 173

Countries’ ability to realise this potential will greatly affect their future energy needs. For example, India’s 2030 energy demand may be 40% higher in a scenario of low energy efficiency vs. one with (very) high energy efficiency; the difference is equivalent to all the energy the country uses today. 174 This has knock-on effects on many other factors, such as the need to import energy, the capital requirements for low-carbon energy generation, and balance-of-payments pressures. On a global scale, the energy required to provide energy services in 2035 could vary by the amount of energy used today by the OECD, depending on whether a high or low efficiency path is struck. 175

Boosting efficiency requires upfront investments, but there is much evidence to suggest that the resulting fuel savings for many measures exceed the costs. Specifically, even adopting just the measures that meet criteria of rapid “pay-back” in terms of the price of energy (and thus imply an acceptable cost of capital and discount rate), the IEA has estimated, could reduce demand by 14% by 2035 relative to a reference case. The US$12 trillion total investment required would yield fossil fuel savings almost twice as large over 20 years. This scenario also suggests that energy efficiency would be cost-effective in the sense that it costs less than an equivalent increase in supply. This brings potential for substantial economic benefits. GDP in the 2030s could be increased by 3% for China, 2% for India, and 1.7% for the United States. Total global economic output could increase by US$18 trillion, close to the combined GDP of the United States and China today. 176 These estimates are borne out by experience in several countries. For example, state-level energy efficiency programmes in the United States regularly save consumers over US$2 for every US$1 invested, and in some cases up to US$5. 177 These magnitudes leave significant room for energy efficiency to remain an attractive option even if there were in fact “hidden costs” or other factors that might dent the estimates proposed by the models.

The potential for efficiency improvements also is growing rapidly. The cost of improving the energy efficiency of buildings has fallen significantly in recent years. 178 Lighting is undergoing a step-change in efficiency with the introduction of light-emitting diodes (LEDs). New opportunities – from much-more efficient air conditioning to automated energy management – promise further reductions (see Chapter 7: Innovation).

Net gains for the climate, but especially for the economy

Some share of the gains may be offset by increased consumption – the “rebound effect”. Improved energy efficiency lowers the effective cost of energy services and the prices of goods that require significant energy for their production. This, in turn, reduces the cost of energy services, increasing consumption of such services, and frees up resources to spend on other goods and services, which can further increase energy consumption. The size of the rebound effect is uncertain, and credible estimates range between 10% and 50%, including economy-wide effects such as lower fuel prices. 179 Levels may be higher still in some cases, and especially in countries with significant unmet demand for energy.

This has led some to argue that energy efficiency is less worthwhile, as it does not translate one-to-one into reduced consumption. However, rebound only occurs to the extent that energy efficiency has economic benefits: it means that end-users enjoy still greater levels of energy services due to improved energy efficiency than they would if there were no rebound. The total resulting energy consumption and emissions will depend on a number of factors, including the structure of the economy, regulatory conditions, and energy prices. To reduce GHG emissions, all of these as well as other factors need to be modulated.

Actions to realise higher efficiency gains

Countries vary significantly in their ability to capture energy efficiency opportunities. The very fact that so much cost-effective potential remains untapped is an indication that it often can be difficult to realise within the market arrangements that now prevail. As a starting point to getting there, appropriate energy pricing is particularly important. The IEA estimates that phasing out fossil fuel consumption subsidies over the next decade could reduce world energy demand by almost 4% by the time subsidies are fully phased out, and by 5% in the following 25 years. By 2030, this could imply reductions in global CO2 emissions of as much as 0.4–1.8 Gt.180 The influence of prices, moreover, can be deep and structural. For example, cheap fuel in countries with low fuel taxation encourages car-centric development, which is a major reason why per capita transport fuel use is nearly three times as high in the United States as in Europe. Likewise, subsidies for energy are a major reason for the Middle East’s declining energy productivity.

Yet efficient pricing alone is unlikely to capture all economically efficient energy efficiency opportunities, especially if there is a substantial upfront cost. Countries that have employed effective additional policy interventions, including standards, information, behavioural “nudges” and other means have seen much greater success in improving the productivity of their energy use. Three characteristics stand out among leaders in this field:

  • Effective understanding of their current status: Countries need to know where they stand, relative to others and relative to where they could be. Measuring and communicating the potential has proven an important step for planning effective interventions and mobilising action.
  • Standards for markets that lack automatic mechanisms to ensure efficiency: When the costs and benefits of efficiency measures do not accrue to the same actors – e.g. with rental properties – there is reduced incentive to invest in efficiency. Energy efficiency standards are then crucial – e.g. building codes, vehicle fuel-efficiency requirements, and appliance standards. Such standards also help induce innovation over time, especially when they are adjusted over time, as in Japan’s Top Runner Program. Governments should exercise caution, however, to ensure that higher upfront costs do not price housing or key services and goods beyond consumers’ reach.
  • Effective finance: Many countries have had success supporting energy efficiency through advantageous finance programmes, such as those of KfW in Germany.Increasingly, new business models also help make finance available, through energy service contracting and other approaches.

The countries that best succeeded in these respects, and which have been able to steer economic activity towards sectors that are more energy productive, are now able to produce twice as much GDP per unit of energy as they did in 1980. 181 In contrast, several other countries have barely improved.

Businesses also can take action to benefit directly from improved energy efficiency. In particular, companies with extensive supply chains have an opportunity to work with their suppliers to increase efficiency. The potential is significant: reducing the energy use of just 30% of the top 1,000 corporations by 10–20% below business-as-usual levels would save about 0.7 Gt CO2 per year by 2020, and likely more as the economy grows in later years. 182 The impact increases when measures are propagated throughout supply chains: a 10% emission reduction in the supply chains of the same 30% of companies would reduce emissions by another 0.2 Gt. There are already many companies taking such steps, such as the 100 companies in the Better Buildings Challenge in the US, which have pledged to reduce the energy intensity of their buildings by 20% over 10 years. 183 Mutually beneficial agreements between companies and their suppliers, such as innovative financing for energy efficiency investments in return for a share of cost reductions through lower future prices, could provide powerful incentives to improve energy efficiency in a range of businesses.

Barriers to a better system

Cumulatively, the developments surveyed above offer substantial promise to relieve a range of pressures on economies by turning to new ways of meeting energy demand. Yet achieving this is far from assured. Today’s energy systems are the result of numerous choices made over several decades, by both public and private actors. They will not change easily. Building an energy system fit for the next 25 years will require deliberate effort – and an updated framework for energy decision-making. In this section, we begin to sketch out that new framework, and identify priorities for policy action. But first, we explore the key barriers to change, and how to overcome them.

Capital investments are a big factor in energy-system inertia: The total global value of energy supply infrastructure has been estimated at US$20 trillion, 184 and much of it – from power plants and transmission networks to steel plants and buildings – is very long-lived (multiple decades). Changing the way energy is supplied and used affects the value of existing infrastructure and may lead to “stranded” assets, with implications for both the energy sector, and those invested in it (see Chapter 6: Finance). Thus, there can be great political resistance to actions that affect energy-sector assets. Conversely, there is a penalty associated with not acting in time, as infrastructure choices today “lock in” dependencies and impacts for a long time in the future.

Governments also have a direct stake in how energy systems work. Many states own substantial stakes in energy companies, and governments derive substantial revenues from energy activities, through taxes and fees. Large numbers of jobs may be on the line.

Moreover, changing energy supplies requires changing laws and regulations, which can be slow and politically fraught. Energy is a heavily regulated sector, not only in terms of energy network monopolies, but also price controls, licenses for new energy activities, standards for energy-using devices, and parameters for how different types of energy supplies are used for power and other purposes. If reforms cannot be achieved, or the regulatory framework is unstable, it will be more difficult to attract capital to new classes of investment.

Another major obstacle to change, already mentioned, is artificially low energy pricing. Prices around the world are set through highly political processes, and often include direct subsidies, lower rates of taxation, or price controls to keep energy affordable. The total gap between the market value of fuels and the prices at which they are sold is more than US$500 billion per year. 185 The influence of low prices goes deep: often they have realigned economic priorities, favouring energy-intensive sectors when their overall costs would not justify it; they have rewarded energy inefficiency and waste; and they have even reshaped the physical landscape, encouraging sprawling cities. They have also depressed energy investment in many countries, magnifying energy access and supply problems. Correcting price distortions is thus crucial to building more productive, robust, flexible and sustainable energy systems. Yet doing so can be very difficult; the most successful efforts have been accompanied by careful measures to avoid negative social and economic impacts.

In addition, today’s energy systems have been shaped by multiple market failures that allow companies and consumers to benefit from individual choices that together harm the economy or society at large. The most visible is the environmental impact of pollution from fossil fuel extraction and combustion, but it extends further, to land and food systems (e.g. for the production of bioenergy) or water (e.g. hydropower, hydraulic fracturing, or thermal-power plant cooling). Less visible, but also significant, is that design choices that affect energy consumption often are out of end-users’ control. Rental properties and urban design are prime examples: in some cases, poor choices made decades ago still limit options and hinder change today. This is a significant challenge for cities, as discussed in Chapter 2: Cities, but also extends to many other energy uses. Over time, energy use patterns are embedded in culture, becoming even harder to change.

Finally, the attractiveness of energy options in one country depends strongly on what others do. For example, a small group of countries pioneered the energy innovations that now create opportunities for all others. Likewise, as noted, widespread action to increase energy efficiency and adopt low-carbon alternatives could take pressure off fossil fuel prices, but countries acting individually do not have enough market power. Overall, cooperation on energy matters can have many benefits, but it is hard to achieve.

These barriers are not a cause for despair or inaction. There are numerous examples where deliberate strategic direction has yielded rapid results, such as the rapid switch to natural gas in the UK and the Netherlands, the build-out of nuclear power in France or Sweden, the reduction in overall energy import dependence in Denmark, and the recent success in extending energy access in rural China. What these examples show, however, is that overcoming inertia in energy systems requires deliberate action. This need not mean government control over energy sectors, but it means governments need to put in place the prerequisites to enable new solutions.

Rethinking energy priorities

These changes must be underpinned by a framework for decision-making fit for a new energy situation and a broader set of priorities. Energy systems need to be more flexible and nimble, able to grow and adapt to fast-changing conditions. They must be better able to meet demand through productivity and efficiency improvements, not just increased supply. They must be able to accommodate a wider range of energy sources, through new business models and trade relationships, and at different scales of operation. They must be able to drive investment and innovations to meet the next wave of demand. And they must be grounded in a full understanding of the costs and benefits of different options, with prices that reflect the true cost of energy, including its impact on security, volatility, balance of payments, pollution, and the climate. Climate in particular, though likely not the top priority for energy decision-makers, is a highly time-sensitive consideration, since choices made over the next 5–15 years will have long-lasting impact on cumulative CO2 emissions.

Decision-makers also need to be more forward-looking, alert to potential environmental or economic missteps that could require expensive corrective action, and conscious of rapid technological change when setting policy. A better handling of uncertainty and risk must be an indispensable part of this. Energy decisions need to account for the value of insurance against adverse scenarios. This will place a greater value on keeping options open until major structural uncertainties are resolved. Early diversification is also an important way to approach the dilemma of making long-term commitments in a situation of irreducible and growing uncertainty.

The next 5–10 years are critical for the future of energy systems. No single approach can meet all countries’ needs; each will have to choose its own pathway, with the best technologies, policies and investment strategies to meet its people’s needs. Still, the Commission has identified broad areas that offer particular promise, with benefits within the next decade. All are areas where near-term policy decisions can make a large medium- to long-term difference. Action in these areas will help countries keep their options open, be flexible, and be able to adjust to a range of future scenarios.

Recommendations

Get energy pricing right: Implement energy prices that enable cost recovery for investment; remove subsidies for fossil fuel consumption, production and investment; avoid lock-in to wasteful economic structures and consumption patterns, and better reflect national wider priorities.

In implementing such reforms, countries should:

  • Eliminate price distortions that perpetuate the under-investment that in turn imperils growth in energy access;
  • Account for social objectives, including by complementing reform with compensating measures to protect the poor; and
  • Put an effective price on carbon emissions as a foundation for overall efforts to reduce climate risk and a more.

Reverse the “burden of proof” for the construction of new coal-fired power, and adopt an improved framework for energy decision-making.

Governments should ensure that new coal fired power is built only when other options have been proven not to be viable when considered against the full set of energy objectives. In high-income countries, commit to avoiding further construction of new unabated coal as a minimum first step to avoid further lock-in to high GHG emissions and accelerate retirements of old plants. In middle-income countries, take steps to limit new construction, and consider avoiding new construction altogether beyond 2025. In all countries, make decisions on the understanding that unabated coal infrastructure cannot be expected to operate beyond 2050.

Such strategies should be underpinned by appreciation of uncertainty rather than single scenarios, and include the following key elements:

  • Start now to build the capacity to use new sources of energy, accounting for the value of having a greater range of options given future uncertainty;
  • Place a value on insurance against adverse scenarios, whether geopolitical or in terms of energy prices;
  • Evaluate the cost of taking future corrective action, including to undo lock-in to high levels of import dependence or air pollution;
  • Incorporate a valuation of exposure to fossil fuel price volatility that cannot be hedged in markets;
  • Account for the ongoing trends in cost, including continued systematic shift in favour of renewable energy sources; and
  • Adopt policies which impose a price on pollution – explicitly through taxation or implicitly through standards or other regulation – with damages from coal-fired power priced at least at US$50/MWh, or more for plants without local air pollution controls.

Raise ambition for zero-carbon electricity.

Without a deliberate reassessment, many countries risk continuing to treat renewable energy as a marginal or experimental part of energy supply, even where it can be a core contributor. The steps and degree of ambition will vary across countries, but include:

  • In fast-growing countries, adapt electricity system planning to enable the integration of renewables;
  • In high-interest countries, enable lower-cost finance and address key risks as the most cost-effective ways to channel public support;
  • In mature economies, adapt market arrangements to support the next wave of innovation to enable a higher share of renewables;
  • Include off-grid and mini-grid solutions in approaches to expanding energy access;
  • Design support systems to create regulatory certainty, minimise distortions to electricity markets, and transparently adjust support levels as costs and circumstances change.

Launch a platform for public-private collaboration for innovation in distributed energy access.

Governments should collaborate to establish and provide resources for a network of regional institutions for a) publicly funded R&D in off-grid electricity, household thermal energy, and micro- and mini-grid applications; and b) incubation of businesses that apply new technologies and new business models for new distributed energy technologies.

This network can build on the strengths of the CGIAR model 186 for key agricultural applications, including public financing of R&D to develop innovations with stronger social outcomes and a distributed institutional structure, through regional hubs, that allows context-specific innovation.

It can further improve on the CGIAR model by adopting a business incubator approach complemented by context-specific social and behavioural approaches:

  • Adopt a portfolio and venture approach, with tolerance for failure of individual businesses as opposed to the risk-minimising approaches often taken in public initiatives;
  • Provide relatively small amounts of seed capital to multiple companies, to help each innovator with a promising new business model or technology grow to scale;
  • Build on social impact investment by using financial leverage to achieve social objectives;
  • Address economic and behavioural hurdles to dissemination of new technology, and develop approaches that are context-specific; and
  • Complement with cash transfers to enable access by the very poor.

Adopt energy demand management measures, to address the barriers that prevent the development of energy-productive economic activity and energy-efficient end use.

A key first step is to get energy prices right, as discussed above. Energy decision-makers should also:

  • Map the potential by creating national roadmaps that identify and prioritise energy efficiency opportunities: countries, companies, and consumers need to know where they stand, relative to others and relative to where they could be.
  • Monitor and develop benchmarking targets for the energy intensity of key industries, extending to voluntary or mandatory programmes, depending on circumstances;
  • Set and frequently update standards where market barriers stand in the way or prices to drive efficiency cannot be implemented, including for buildings, appliances, and vehicles. Standards need to balance the benefits of efficiency against costs to ensure net higher access to key energy services for low-income consumers.
  • Provide concessional and other finance to ensure that measures to improve efficiency at a minimum benefits from the same support that is extended to enable the expansion of energy supply.

Address non-CO2 GHG emissions from energy, starting by accelerating efforts to identify and curtail fugitive methane emissions.

Policy interventions are needed to improve measurement and monitoring, accelerate voluntary initiatives that help raise awareness, create incentives for higher-cost measures, and introduce new standards for maximum fugitive emissions from oil and gas systems. Enforcement should also become increasingly stringent over time.

Methane emissions from oil and gas supply and distribution have a significant climate impact and can be reduced at negative or low cost, and with co-benefits from improved air quality. Several measures can help spur action:

  • Launch a major initiative to improve understanding of methane leakage levels around the world, through increased measurement and monitoring, and use the resulting data to inform decision-making and GHG mitigation strategies.
  • In the near-term, put in place the requirements (industry initiatives, incentive schemes, and enforced and sufficient regulation) to enable changes to practices and support selected investment initiatives in the upstream oil and gas sector.
  • Over a longer period (decade or more) make methane leakage reduction a core component of network construction and maintenance.
  1. The World Bank, n.d. Energy use (kg of oil equivalent per capita). World Development Indicators. LINK [Accessed 4 June 2014.]. The data refer to energy consumption and pollution in 2011.

  2.  This includes an estimated US$23 trillion in energy supply and US$24 trillion across transport engines and energy use in buildings and industry. See Chapter 6: Finance for a more detailed discussion of future energy infrastructure needs, as well as the New Climate Economy Technical Note, Infrastructure Investment Requirements in a Low-Carbon Economy, to be available at: LINK.

  3. See, e.g., IPCC, 2014. Chapter 6: Assessing Transformation Pathways, In Climate Change 2014: Mitigation of Climate Change. Contribution of Working Group III to the Fifth Assessment Report of the Intergovernmental Panel on Climate Change. O. Edenhofer, R. Pichs-Madruga, Y. Sokona, E. Farahani, S. Kadner, et al. (eds.). Cambridge University Press, Cambridge, UK, and New York. LINK

  4. Estimates vary between 49% to 2011 or 54% to 2012, depending on methodology and data sources. See BP, 2013. BP Statistical Review of World Energy June 2013. London. Also: International Energy Agency (IEA), 2013. World Energy Outlook 2013. Paris. LINK

  5. World GDP in 2012 was US$73.2 trillion, up from US$36.3 trillion in 1990. The World Bank, n.d., World Development Indicators. See data for GDP (constant 2005 US$), 1990-2012. LINK

    Also: International Energy Agency (IEA), 2013. World Energy Outlook 2013. Paris. LINK 

  6. Global primary energy consumption rose by 3,388 million tonnes of oil equivalent (Mtoe) from 2000 to 2013, to 12,730 Mtoe; in that same period, China’s primary energy consumption rose by 1,872 Mtoe, to 2852.4 Mtoe in 2013. See BP, 2014. BP Statistical Review of World Energy June 2014. London. LINK

  7. This range is based on a New Climate Economy staff review of recent projections, including:

    19% in the New Policies Scenario and 25% in the Current Policiesscenario in: International Energy Agency (IEA), 2013. World Energy Outlook 2013. Paris. LINK

    26% in the 6DS scenario in: IEA, 2012. Energy Technology Perspectives 2012.

    27% estimate in: US Energy Information Administration (EIA), 2013. International Energy Outlook. DOE/EIA-0484(2013). Washington, DC. LINK

    29–33% range provided in baselines developed for: GEA, 2012. Global Energy Assessment – Toward a Sustainable Future, 2012. Cambridge University Press, Cambridge, UK, and New York, and International Institute for Applied Systems Analysis, Laxenburg, Austria.

  8. Primary energy data series from BP, 2013. Statistical Review of World Energy 2013. Note that the online data have been updated, and the URL links to the 2014 version. Data downloaded from the now-removed 2013 version were used in the preparation of this figure and most of this chapter, as 2014 data were not yet available.

  9. Primary energy data series from BP, 2013. Statistical Review of World Energy 2013. Note that the online data have been updated, and the URL links to the 2014 version. Data downloaded from the now-removed 2013 version were used in the preparation of this figure and most of this chapter, as 2014 data were not yet available.

  10. All data cited here are from BP, 2013. BP Statistical Review of World Energy June 2013. Single-year data are for 2012.

  11. In 1970 electricity was 9% of final energy consumption, rising to 17% in 2011. See International Energy Agency (IEA), 2014. Energy Technology Perspectives 2014. Paris. LINK

  12. IEA, 2013. World Energy Outlook 2013.

  13. Data refer to 2011 or 2012 where available. See: The World Bank, n.d. World Development Indicators. LINK[Accessed 6 June 2014.]

  14. Data refer to 2012 unless otherwise stated. See BP, 2013. BP Statistical Review of World Energy June 2013.

  15. The World Bank, n.d. Global Economic Monitor (GEM) CommoditiesLINK [Accessed 6 June 2014.]

  16. Enerdata, n.d. Global Energy and CO2 Data. LINK [Accessed 9 June 2014.]

    For a freely accessible summary of the data, see: LINK [Accessed 15 August 2014.]

  17. BP, 2013. BP Statistical Review of World Energy June 2013.

  18. BP, 2013. BP Statistical Review of World Energy June 2013.

  19. See Xinhua, 2014. China declares war against pollution. 5 March. LINK

  20. For energy-related emissions outside direct industry emissions, see all sectors except AFOLU and waste in Figure TS.3a in: IPCC, 2014. Technical Summary. In Climate Change 2014: Mitigation of Climate Change. Contribution of Working Group III to the Fifth Assessment Report of the Intergovernmental Panel on Climate Change. O. Edenhofer, R. Pichs-Madruga, Y. Sokona, E. Farahani, S. Kadner, et al. (eds.). Cambridge University Press, Cambridge, UK, and New York. LINK

    For direct energy-related emissions in industry, see Table 10.2 of Fischedick, M. and Roy, J., 2014. Chapter 10: Industry. In Climate Change 2014: Mitigation of Climate Change. Contribution of Working Group III to the Fifth Assessment Report of the Intergovernmental Panel on Climate Change. O. Edenhofer, R. Pichs-Madruga, Y. Sokona, E. Farahani, S. Kadner, et al. (eds.). Cambridge University Press, Cambridge, UK, and New York. LINK

  21. IPCC, 2013. Summary for Policymakers. In Climate Change 2013: The Physical Science Basis. Contribution of Working Group I to the Fifth Assessment Report of the Intergovernmental Panel on Climate Change. T. F. Stocker, D. Qin, G.-K. Plattner, M. M. B. Tignor, S. K. Allen, et al. (eds.). Cambridge University Press, Cambridge, UK, and New York. LINK

  22. The estimates are relative to 2010 levels and vary between scenarios for future emissions. See: IPCC, 2014. Summary for Policymakers. In Climate Change 2014: Mitigation of Climate Change. Contribution of Working Group III to the Fifth Assessment Report of the Intergovernmental Panel on Climate Change. O. Edenhofer, R. Pichs-Madruga, Y. Sokona, E. Farahani, S. Kadner, et al. (eds.). Cambridge University Press, Cambridge, UK, and New York. LINK

  23. Bruckner, T., Bashmakov, I. A. and Mulugetta, Y., 2014. Chapter 7: Energy systems. In Climate Change 2014: Mitigation of Climate Change. Contribution of Working Group III to the Fifth Assessment Report of the Intergovernmental Panel on Climate Change. O. Edenhofer, R. Pichs-Madruga, Y. Sokona, E. Farahani, S. Kadner, et al. (eds.). Cambridge University Press, Cambridge, UK, and New York. LINK

  24. From 1997 to 2013, CO2 emissions from energy rose by 44%. See: BP, 2014. BP Statistical Review of World Energy June 2014.

  25. Prominent scenarios include IEA, 2014. Energy Technology Perspectives 2014, as well as the pathways explored in: GEA, 2012. Global Energy Assessment. A more comprehensive review of the literature is contained in IPCC, 2014. Summary for Policymakers (IPCC AR5, Working Group III).

  26. BP, 2014. BP Statistical Review of World Energy June 2014.

    BGR, 2013. Reserves, Resources and Availability of Energy Resources 2013. Bundesanstalt für Geowissenschaften und Rohstoffe (Federal Institute for Geosciences and Natural Resources), Hannover, Germany. LINK

    World Energy Council, 2013. World Energy Resources: 2013 Survey. London. LINK

    Previously cited sources: GEA, 2012. Global Energy Assessment. IPCC, 2013. Summary for Policymakers (AR5, Working Group I).

  27. International Energy Agency (IEA), 2014. World Energy Investment Outlook. Special report. Paris. LINK (See p.52; note that the total investment figure includes coal.)

  28. BP, 2013. BP Statistical Review of World Energy June 2013.

  29. Wang, J., Hallding, K. and Tang, X., 2014. China’s Coal Envelope – How Coal Demand Growth and Supply Constraints Are Shaping China’s Future Options. New Climate Economy contributing paper. China University of Petroleum, Beijing, and Stockholm Environment Institute, Stockholm. LINK

    Also see the New Policies Scenario in IEA, 2013. World Energy Outlook 2013.

  30. BP, 2013. BP Statistical Review of World Energy June 2013.

  31. Planning Commission of the Government of India, 2013. India Energy Security Scenarios 2047LINK

  32. See: World Health Organization (WHO), 2014. Ambient (outdoor) air pollution in cities database 2014. LINK

  33. IEA, 2013. World Energy Outlook 2013.

  34. See US Energy Information Administration (EIA), 2014. Annual Energy Outlook 2014 – with Projections to 2040. Washington, DC. LINK

  35. See also: Bianco, N., Meek, K., Gasper, R., Obeiter, M., Forbes, S., and Aden, N., 2014. Transitioning to a New Climate Economy: An Analysis of Existing and Emerging Opportunities for the United States. New Climate Economy contributing paper. World Resources Institute, Washington, DC. LINK

  36. Primary energy demand grew by 81% in 2000–2012. See BP, 2013. BP Statistical Review of World Energy June 2013.

  37. Corporación Andina de Fomento, 2013. Energía: Una Visión sobre los Retos y Oportunidades en América Latina y el Caribe, CAF / Latin American Development Bank, Montevideo, Uruguay. LINK

  38. Tissot, R., 2012. Latin America’s Energy Future, Washington, DC. LINK

  39. These regions are home to the large majority of the 1.3 billion people worldwide who lack access to electricity and 2.6 billion who lack access to modern cooking facilities. Without substantial new efforts, the IEA estimates that as many as 1 billion people could still lack access to electricity in 2030 (some other scenarios suggest 600-850 million), and 2.7 billion lack access to clean cooking facilities.

    See: International Energy Agency (IEA), 2011. Energy for All: Financing Access for the Poor. Special early excerpt of the World Energy Outlook 2011. First presented at the Energy For All Conference in Oslo, Norway, October 2011. LINK

  40. The World Bank, n.d. Energy use (kg of oil equivalent per capita), 2010. World Development Indicators. LINK [Accessed 9 June 2014.]

  41. IRENA, 2013. Africa’s Renewable Future: The Path to Sustainable Growth. International Renewable Energy Agency, Abu Dhabi. LINK

    See also: Jürisoo, M., Pachauri, S., Johnson, O. and Lambe, F., 2014. Can Low-Carbon Options Change Conditions for Expanding Energy Access in Africa? SEI and IIASA discussion brief, based on a New Climate Economy project workshop. Stockholm Environment Institute, Stockholm, and International Institute for Applied Systems Analysis, Laxenburg, Austria. LINK

    For a discussion of South Asia, see, e.g., Wijayatunga, P. and Fernando, P.N., 2013. An Overview of Energy Cooperation in South Asia. South Asia Working Paper Series, No. 19. Asian Development Bank, Manila, Philippines. LINK

  42. These areas are not logically or causally independent – the changing outlook for coal power, e.g., is driven by several of the other areas. Instead, we see these as areas that each warrant attention, and which will be used to frame the discussion in the rest of the chapter.

  43. The latest available data are for 2012. See International Energy Agency, n.d. World Energy Statistics and Balances. LINK

  44. For illustration, in a scenario of continued high energy intensity and coal dependence, GDP growth of 6.5%, and accelerated depletion of domestic coal deposits, China’s import requirements would rise to 2 billion tonnes, or 30% of its total coal consumption, by the mid-2020s. See Wang et al., 2014 (forthcoming), China’s Coal Envelope.

  45. The latest available data are for 2012. See International Energy Agency, n.d. World Energy Statistics and Balances. LINK [Accessed 9 June 2014.]

  46. Planning Commission of the Government of India, 2013. India Energy Security Scenarios 2047.

  47. IEA, 2013. World Energy Outlook 2013.

    Planning Commission of the Government of India, 2013. India Energy Security Scenarios 2047LINK

    EIA, 2013. International Energy Outlook 2013.

    Wang et al., 2014 (forthcoming), China’s Coal Envelope.

    Wood Mackenzie 2013. International thermal coal trade: What Will the Future Look Like for Japanese Buyers? Presentation for the Clean Coal Day 2013 International Symposium, Tokyo, 4-5 September 2013.

  48. The World Bank, n.d. Global Economic Monitor (GEM) Commodities.

  49. UN Water, 2014. The United Nations World Water Development Report 2014 – Water and Energy (Volume 1). LINK

  50. Wang, J., Feng, L. and Tverberg, G. E., 2013. An analysis of China’s coal supply and its impact on China’s future economic growth. Energy Policy, 57. 542–551. DOI:10.1016/j.enpol.2013.02.034.

  51. More specifically, coal use without CCS. Coal use with CCS grows considerably in many scenarios, although total coal use is still reduced significantly. See, e.g., IEA, 2013, World Energy Outlook 2013, andIPCC, 2014. Summary for Policymakers (IPCC AR5, Working Group III).

  52. Rogner, H. et al., 2012. Chapter 7: Energy Resources and Potentials. In Global Energy Assessment – Toward a Sustainable Future. Cambridge University Press, Cambridge, UK, and New York, and International Institute for Applied Systems Analysis, Laxenburg, Austria. LINK

  53. NCE, SEI, 2014. NCE Contributing Paper: Coal-fired power generation – the challenge of emissions and capital lock-in (in preparation).

  54. Current Policies scenario in IEA, 2013. World Energy Outlook 2013.

  55. New Policies scenario in IEA, 2013. World Energy Outlook 2013.

  56. For example, the IEA 2DS scenario sees unabated coal-fired power generation falling to just over half of current levels by 2030, with more than a third of that again fitted with CCS, and to around one-tenth of current levels by 2050. The scenarios in the Global Energy Assessment envision similar reductions, but highlight that the exact trajectory depends on technology and other assumptions; see the scenarios in GEA, 2012, Global Energy Assessment, and: International Energy Agency (IEA), 2012. Energy Technology Perspectives 2012: Pathways to a Clean Energy System. Paris. LINK. 11 Gt corresponds to the total reductions in the 450 scenario relative to the Current Policies scenario.  See IEA, 2013, World Energy Outlook 2013.

  57.  The estimated range is likely cost-effective reductions of 4.7-6.6 Gt CO2 / year, through a combination of policies already announced (2.9 Gt), energy efficiency potential (0.9-1.8 Gt) and fuel switching away from coal in the power sector (0.9-1.8 Gt).  The energy efficiency potential is based on modelling studies including the IEA Efficient World scenario (IEA, 2012), and accounts for overlaps with the analyses of potential through specific energy efficiency opportunities in buildings (See Chapter 2), energy efficiency opportunities in manufacturing (see Ch 7), and modelling studies of the impacts of removing fossil fuel subsidies (see section 3.6).  The estimate assumes that 50-100% of the potential identified as cost-effective in these studies is cost-effective once accounting for reasonable ‘payback’ periods for investment and factors such as potential ‘hidden’ costs, the potential for greater rebound effects, and co-benefits such as reduced air pollution. The fuel switching potential corresponds to a further 20-40% fuel switching away from coal over and above policies already announced (as per the IEA New Policies scenario), motivated by a combination of reduced air pollution health effects (see section 3.2), as well as the increasing potential for cost-effective use of renewable energy (see section 3.3, and in particular the discussion of the IRENA REmap options).  For further discussion of the scope and limitations of these estimates, see: New Climate Economy, 2014 (forthcoming). Quantifying Emission Reduction Potential. New Climate Economy contributing paper. London. LINK

  58. Personal communication with EBRD, August 2014.

  59. For a brief discussion of CCS “readiness” and CCS retrofitting, see, e.g., Box 8 of International Energy Agency (IEA), 2013. Technology Roadmap: Carbon Capture and Storage 2013. Paris. LINK

  60. See, e.g., IPCC, 2014, Summary for Policymakers (IPCC AR5, Working Group III), and the range of scenarios in GEA, 2012. Global Energy Assessment.

    Also: IPCC, 2005. IPCC Special Report on Carbon Dioxide Capture and Storage. Prepared by Working Group III of the Intergovernmental Panel on Climate Change (Metz, B., O. Davidson, H.C. de Coninck, M. Loos, and L.A. Meyer, eds.). Cambridge University Press, Cambridge, UK, and New York. LINK

  61. See Van Noorden, R., 2014. Two plants to put “clean coal” to test. Nature, 509(7498). 20–20. DOI:10.1038/509020a.

  62. In the context of this paragraph understood as fulfilling its role in the IEA’s 2°C Scenario (2DS). See IEA, 2012, Energy Technology Perspectives 2012. Note that the medium-term mitigation amount attributed to CCS is slightly reduced in the 2DS of the most recent version: IEA, 2014, Energy Technology Perspectives 2014.

  63. See IEA, 2013. Technology Roadmap: Carbon Capture and Storage 2013.

  64. EOR involves pumping an inert liquid or gas such as CO2 into an oil reservoir, and using the pressure to force hard-to-recover oil towards the production well. For a detailed explanation, see: LINK [Accessed 18 August 2014.]

  65. See Global CCS Institute, 2014. The Global Status of CCSLINK

    Confirmed here means that an investment decision has been taken (as of February 2014). The total increases to more than 80 projects and 115 million tonnes of CO2 per year when including proposed projects with no investment decision, though the CO2 in most cases would be used for enhanced oil recovery, which might not include the confirmed permanent storage and monitoring assumed in the IEA roadmap.

  66. Analysis by the NCE project team, based on interpolation of numbers from IEA, 2012, Energy Technology Perspectives 2012.

  67. IEA, 2013. Technology Roadmap: Carbon Capture and Storage 2013.

  68. IEA, 2013. Technology Roadmap: Carbon Capture and Storage 2013.

  69. See Chapter 7: Innovation, as well as IEA, 2013. Technology Roadmap: Carbon Capture and Storage 2013, Box 3.

  70. Abellera, C., and Short, C. / Global CCS Institute, 2011. The Costs of CCS and Other Low-Carbon Technologies. In Global CCS Institute Issues Brief 2011, no. 2. LINK

  71. A New Climate Economy background paper provides a detailed account of air pollution impacts; see: Kuylenstierna, J.C.I., Vallack, H.W., Holland, M., Ashmore, M., Schwela, D., Wei Wan, Terry, S., Whitelegg, J., Amann, M., and Anenberg, S., 2014 (forthcoming). Air Pollution Benefits of Climate Strategies.

  72. Lim, S.S. et al., 2012. A comparative risk assessment of burden of disease and injury attributable to 67 risk factors and risk factor clusters in 21 regions, 1990–2010: a systematic analysis for the Global Burden of Disease Study 2010. The Lancet, 380(9859). 2224–2260. DOI: 10.1016/S0140-6736(12)61766-8.

  73. World Health Organization, 2014. 7 million premature deaths annually linked to air pollution. WHO press release. LINK

  74. Van Dingenen, R. et al., 2009. The global impact of ozone on agricultural crop yields under current and future air quality legislation. Atmospheric Environment, 43(3). 604–618. DOI: 10.1016/j.atmosenv.2008.10.033.

  75. Based on analysis for the Commission of a range of studies. See: Hamilton, K., Brahmbhatt, M., Bianco, N., and Liu, J.M., 2014. Co-benefits and Climate Action. New Climate Economy contributing paper. World Resources Institute, Washington, DC. LINK

  76. See Klevnäs, P. and Korsbakken, J. I., 2014. A Changing Outlook for Coal Power. New Climate Economy contributing paper. Stockholm Environment Institute, Stockholm. LINK

  77. Parry, I., 2014. Ancillary Benefits of Carbon Pricing. New Climate Economy contributing paper. International Monetary Fund. LINK The paper estimates costs of US$57.5/MWh, which corresponds to US$49/MWh for a coal plant with 40% efficiency. The number is an emissions-weighted average.

  78. Epstein, P.R., Buonocore, J. J., Eckerle, K., Hendryx, M., Stout III, B.M., et al., 2011. Full cost accounting for the life cycle of coal. Annals of the New York Academy of Sciences, 1219(1). 73–98. DOI:10.1111/j.1749-6632.2010.05890.x.

  79. US Energy Information Administration (EIA), 2014. Levelized Cost and Levelized Avoided Cost of New Generation Resources in the Annual Energy Outlook 2014. LINK LCOE for conventional coal in Table 1.

  80. European Energy Agency, 2008. External costs of electricity production. EN35. Copenhagen. LINK 

  81. Bianco, N., Meek, K., Gasper, R., Obeiter, M., Forbes, S., and Aden, N., 2014. Transitioning to a New Climate Economy: An Analysis of Existing and Emerging Opportunities in the United States. New Climate Economy contributing paper. World Resources Institute, Washington, DC. LINK Data taken from form EIA-860 of the US Energy Information Administration.

  82. Particulate matter (PM), a mix of tiny solid and liquid particles suspended in the air, affects more people than any other air pollutant. The most health-damaging particles have a diameter of 10 microns or less, which can penetrate the lungs; these are referred to as PM10. In many cities, the concentration of particles under 2.5 microns is also measured; this is PM2.5. See: World Health Organization, 2014. Ambient (outdoor) air quality and health. Fact Sheet No. 313. Geneva. LINK 

  83. Kan, H., Chen, B., and Hong, C., 2009. Health Impact of Outdoor Air Pollution in China: Current Knowledge and Future Research Needs. Environmental Health Perspectives, 117(5), A187–A187. DOI: 10.1289/ehp.12737.

  84. Zhang, Q., He, K., and Huo, H., 2012. Policy: Cleaning China’s air. Nature, 484(7393), 161–162. DOI: 10.1038/484161a.

  85.  Hamilton, K., Brahmbhatt, M., Bianco, N., and Liu, J.M., 2014 (forthcoming). Co-benefits and Climate Action. New Climate Economy contributing paper. World Resources Institute, Washington, DC. LINK

  86. [[NCE China study, Tsinghua]] Insert a reference to the NCE China study when finalised.

  87. See Wang, J., Hallding, K. and Tang, X., 2014. China’s Coal Envelope – How Coal Demand Growth and Supply Constraints Are Shaping China’s Future Options. New Climate Economy contributing paper.

    See also Strambo, C., Chen, B., Hallding, K. and Han, G., 2014. The Greater Beijing Region Air Quality Control Programme: Prospects and Challenges. New Climate Economy contributing paper. Beijing Normal University, Beijing, and Stockholm Environment Institute, Stockholm. LINK

  88. This box summarises a study produced for the Commission: Strambo et al., 2014 (forthcoming). The Greater Beijing Region Air Quality Control Programme: Prospects and Challenges.

  89. For context, Hebei was found to have a Human Development Index of 0.691 in 2010; the United Nations Development Programme’s latest HDI analysis puts the cut-off for “high human development” at 0.7, and China qualifies, with an overall HDI of 0.719 in 2013. For national rankings: LINK

    For the China study that estimated HDIs for different Chinese regions, including Hebei, see: UNDP China and Institute for Urban and Environmental Studies, 2013. China Human Development Report 2013: Sustainable and Liveable Cities: Toward Ecological Civilization. United Nations Development Programme and Chinese Academy of Social Sciences, Beijing. LINK

  90. See, for example: Xinhua, 2013. Xinjiang to launch huge coal gasification project. 6 October. LINK However, after a surge in coal-to-gas projects, the government has recently tried to rein in “irrational” development of large-scale projects. See: Xinhua, 2014. China to curb blind investment in coal-to-gas. 22 July. LINK

  91. This section focuses on electricity, but options to use renewable energy also exist across heating, industry, and transport systems. A recent assessment by the International Renewable Energy Agency (IRENA) also identifies significant opportunities for cost-effective uses across these sectors. See: International Renewable Energy Agency (IRENA), 2014. REmap 2030: A Renewable Energy Roadmap. Abu Dhabi. LINK

  92. The other main use of renewable energy is traditional biomass for cooking in low-income countries, which we discuss below.

  93. International Energy Agency (IEA), 2014. Electricity Information (2014 preliminary edition). IEA Data Services. LINK

  94. IEA, 2013. World Energy Outlook 2013.

  95. For example, prevailing policies and technology options in 2000 led the IEA’s World Energy Outlook 2000 to a reference scenario of 34 GW of wind power globally by 2010, but improving technology and policy support meant actual 2010 capacity was more than 200 GW. This is replicated across other renewables technologies, as many have improved much faster than had been expected and policies have changed (See: LINK for an archive of WEO reports). Similar trends are seen in scenarios made by the U.S. Energy Information Administration (EIA) and many others in the last two decades.

  96. Lantz, E., Wiser, R. and Hand, M., 2012. The Past and Future Cost of Wind Energy. IEA Wind Task 26, Work Package 2; NREL/TP-6A20-53510. Golden, CO, US: National Renewable Energy Laboratory. LINK

  97. Cost comparisons quoted here do not in general include full system costs / grid costs, as discussed in subsequent sections. For cost estimates and statements on auctions, see:

    REN21, 2014. Renewables 2014 Global Status Report. Paris: Renewable Energy Policy Network for the 21st Century. LINK

    And:

    International Energy Agency (IEA), 2013. Technology Roadmap: Wind Energy – 2013 Edition. Paris. LINK

  98. Liebreich, M., 2014. Keynote address, Bloomberg New Energy Finance Summit 2014, New York, April 7. LINK

  99. IEA, 2014. Energy Technology Perspectives 2014 (module prices).

  100. Ernst & Young, 2013. Country Focus: Chile. RECAI: Renewable Energy Country Attractiveness Index, 39 (November), pp.24–25. LINK

  101. REN21, 2014. Renewables 2014 Global Status Report.

  102. International Renewable Energy Agency (IRENA), 2012. IRENA, 2012. Solar Photovoltaics. Renewable Energy Technologies: Cost Analysis Series, Volume 1: Power Sector, Issue 4/5. International Renewable Energy Agency, Abu Dhabi. LINK

  103. Channell, J., Lam, T., and Pourreza, S., 2012. Shale and Renewables: a Symbiotic Relationship. A Longer-term Global Energy Investment Strategy Driven by Changes to the Energy Mix. Citi Research report, September 2012. LINK

    EIA, 2014. Levelized Cost and Levelized Avoided Cost of New Generation Resources in the Annual Energy Outlook 2014. LCOE for conventional coal in Table 1.

    International Energy Agency (IEA), 2014. Power Generation in the New Policies and 450 Scenarios – Assumed investment costs, operation and maintenance costs and efficiencies in the IEA World Energy Investment Outlook 2014. Capital costs for subcritical steam coal plants. Spreadsheet available at: LINK

    Nemet, G.F., 2006. Beyond the learning curve: factors influencing cost reductions in photovoltaics. Energy Policy, 34(17). 3218–3232. DOI:10.1016/j.enpol.2005.06.020.

  104. Channell, J., Lam, T., and Pourreza, S., 2012. Shale and Renewables: a Symbiotic Relationship. A Longer-term Global Energy Investment Strategy Driven by Changes to the Energy Mix. Citi Research report, September 2012. LINK

    EIA, 2014. Levelized Cost and Levelized Avoided Cost of New Generation Resources in the Annual Energy Outlook 2014. LCOE for conventional coal in Table 1.

    International Energy Agency (IEA), 2014. Power Generation in the New Policies and 450 Scenarios – Assumed investment costs, operation and maintenance costs and efficiencies in the IEA World Energy Investment Outlook 2014. Capital costs for subcritical steam coal plants. Spreadsheet available at: LINK

    Nemet, G.F., 2006. Beyond the learning curve: factors influencing cost reductions in photovoltaics. Energy Policy, 34(17). 3218–3232. DOI:10.1016/j.enpol.2005.06.020.

  105. REN21, 2014. Renewables 2014 Global Status Report.

  106. Liebreich, M., 2014. Keynote address, Bloomberg New Energy Finance Summit 2014.

  107. REN21, 2014. Renewables 2014 Global Status Report.

  108. IEA, 2014. Energy Technology Perspectives 2014.

  109. International Renewable Energy Agency, n.d. IRENA Renewable Energy Country Profiles. LINK [Accessed 11 June, 2014.]

  110. IEA, 2013. World Energy Outlook 2013. Also see: Turkenburg, W. C., Arent, D. J., Bertani, R., Faaij, A., Hand, M., et al., 2012. Chapter 11: Renewable Energy. In Global Energy Assessment – Toward a Sustainable Future. Cambridge University Press, Cambridge, UK, and New York, and International Institute for Applied Systems Analysis, Laxenburg, Austria. 761–900. LINK

  111. IRENA, 2014. REmap 2030: A Renewable Energy Roadmap.

  112. REN21, 2014. Renewables 2014 Global Status Report.

  113. World Resources Institute, 2013. Renewable Energy in China: A Graphical Overview of 2013. ChinaFAQs, The Network for Climate and Energy Information. LINK

  114. REN21, 2014. Renewables 2014 Global Status Report.

  115. Ernst & Young, 2013. Country Focus: Chile. RECAI: Renewable Energy Country Attractiveness Index.

  116. International Renewable Energy Agency (IRENA), 2013. Africa’s Renewable Future: the Path to Sustainable Growth. Abu Dhabi. LINK

  117. Tessama, Z. et al., 2013. Mainstreaming Sustainable Energy Access into National Development Planning: the Case of Ethiopia, SEI Working Paper No. 2013-09. Stockholm: Stockholm Environment Institute. LINK

  118. BP, 2014. BP Statistical Review of World Energy June 2014. The ranges reflect medium to large OECD countries, but exclude a few outliers.

  119. Projections here and in the following paragraph are based on rounded ranges for regions and major countries in the IEA’s Current Policies and New Policiesscenarios, as presented in: IEA, 2013. World Energy Outlook 2013.

  120. IEA, 2013. World Energy Outlook 2013.

  121. Turkenburg et al., 2012. Chapter 11: Renewable Energy.

  122. Bruckner et al., 2014, Chapter 7: Energy systems (IPCC AR5, Working Group III).

  123. IEA, 2014. Electricity Information (2014 preliminary edition).

  124. Escobar Rangel, L. and Lévêque, F. (2012). Revisiting the Cost Escalation Curse of Nuclear Power: New Lessons from the French Experience. HAL Working Paper. Paris: Centre d’Économie Industrielle, MINES ParisTech. LINK

  125. GEA, 2012. Global Energy Assessment.

  126. IEA, 2013. World Energy Outlook 2013.

  127. IEA, 2013. World Energy Outlook 2013.

  128. Klevnäs, P. and Korsbakken, J. I., 2014. Benefits, Prospects and Challenges for Renewable Electricity Generation. New Climate Economy contributing paper. Stockholm Environment Institute, Stockholm. LINK

  129. IRENA, 2014. REmap 2030: A Renewable Energy Roadmap.

  130. By way of comparison, US$20/MWh is around 20% of the cost of new coal-fired power in the United States. LINK

  131. Based on the subsidies volumes and generation in the New Policies scenario in: International Energy Agency (IEA), 2012. World Energy Outlook 2012. Paris. LINK

    For a summary of scenarios, see REN21, 2013. Renewables Global Futures Report 2013. Renewable Energy Policy Network for the 21st Century, Paris. LINK

    See also Bloomberg New Energy Finance 2030 market outlook: LINK and LINK

  132. IRENA, 2014. REmap 2030: A Renewable Energy Roadmap.

  133. See, e.g., IEA, 2014. Energy Technology Perspectives 2014. Chapter 4.

  134. For further discussion of such innovations, see: REN21, 2013. Renewables Global Futures Report 2013, and International Energy Agency (IEA), 2014. The Power of Transformation – Wind, Sun and the Economics of Flexible Power Systems. Paris. LINK

  135. GE Energy Consulting, 2014. PJM Renewable Integration Study. Prepared for PJM Interconnection LLC. LINK

  136. National Renewable Energy Laboratory (NREL), 2012. Renewable Electricity Futures Study. M. M. Hand, S. Baldwin, E. DeMeo, J.M. Reilly, T. Mai, D. Arent, G. Porro, M. Meshek, and D. Sandor (eds.). NREL/TP-6A20-52409. LINK

  137. IRENA, 2014. REmap 2030: A Renewable Energy Roadmap.

  138. For an in-depth discussion, see Klevnäs and Korsbakken, 2014. Benefits, Prospects and Challenges for Renewable Electricity Generation.

  139. IEA, 2014. Energy Technology Perspectives 2014.

  140. Climate Policy Initiative, 2014. Roadmap to a Low Carbon Electricity System in the U.S. and Europe. LINK

    See also Chapter 6: Finance.

  141. See Chapter 6: Finance for more details about the opportunity to reduce costs by improving on financing arrangements.

  142. See Chapter 5: Economics of Change for further discussion of such policy interactions.

  143. See REN21, 2014, Renewables 2014 Global Status Report, Chapter 2. For a more detailed discussion, see: Davidson, M., 2013. Transforming China’s Grid: Integrating Wind Energy Before It Blows Away. The Energy CollectiveLINK

  144. IEA, 2011. Energy for All

  145. See, e.g., Adkins, E., Eapen, S., Kaluwile, F., Nair, G. and Modi, V., 2010. Off-grid energy services for the poor: Introducing LED lighting in the Millennium Villages Project in Malawi. Energy Policy, 38(2). 1087–1097. DOI:10.1016/j.enpol.2009.10.061.

    Gustavsson, M., 2007. Educational benefits from solar technology – Access to solar electric services and changes in children’s study routines, experiences from eastern province Zambia. Energy Policy, 35(2). 1292–1299. DOI:10.1016/j.enpol.2006.03.019.

  146. Goldemberg, J. and Johansson, T., eds., 2004. World Energy Assessment Overview: 2004 Update. United Nations Development Programme, United Nations Department of Economic and Social Affairs, and World Energy Council. LINK

  147. Ostojic, D., Jammi, R., Barnes, D., Sanghvi, A., Mathur, S., Zhang, Y. and Durix, L., 2011. One Goal, Two Paths : Achieving Universal Access to Modern Energy in East Asia and the Pacific. Report No. 64669. The World Bank, Washington, DC. LINK

  148. Pachauri, S., Ruijven, B. J. van, Nagai, Y., Riahi, K., Vuuren, D. P. van, Brew-Hammond, A. and Nakicenovic, N., 2013. Pathways to achieve universal household access to modern energy by 2030. Environmental Research Letters, 8(2). 024015. DOI:10.1088/1748-9326/8/2/024015.

  149.  An estimated that 4.3 million people died in 2012 due to indoor air pollution, almost all in populations reliant on biomass fuels. See: World Health Organization (WHO), 2014. Burden of Disease from Household Air Pollution for 2012. Geneva. LINK

  150. IEA, 2011. Energy for All.

  151. This is both because the absolute amount of energy required is small and because increased CO2 emissions would be offset in part by reduced emissions of non-CO2 GHGs. See Pachauri et al., Pathways to achieve universal household access.

    Country estimates confirm the global findings; for example a study in coal-heavy South Africa found that connecting 3.4 million households to the grid to ensure universal access to electricity by 2020 would add 13Mt of CO2 emissions, about 1.8% of the country’s total projected GHGs for that year; see Tait, L. & Winkler, H., 2012. Estimating greenhouse gas emissions associated with achieving universal access to electricity in South Africa. Energy Research Centre, University of Cape Town. LINK

  152. See: LINK and discussion of it in Chapter 3: Land Use.

  153.  For a summary of the workshop and detailed proceedings, see: LINK

    See also: Jürisoo et al., 2014. Can Low-Carbon Options Change Conditions for Expanding Energy Access in Africa

  154. BP, 2013. BP Statistical Review of World Energy June 2013.

  155. IPCC, 2014, Summary for Policymakers (IPCC AR5, Working Group III).

  156. The World Bank, n.d. Global Economic Monitor (GEM) Commodities.

  157. BP, 2013. BP Statistical Review of World Energy June 2013.

  158. See Lazarus, M., Tempest, K., Klevnäs, P. and Korsbakken, J. I., 2014. Natural Gas: Guardrails for a Potential Climate Bridge. New Climate Economy contributing paper. Stockholm Environment Institute, Stockholm. LINK

  159. This section summarises the findings of an NCE background paper on the conditions under which natural gas might act as a bridge fuel to a low-carbon future. See Lazarus et al., 2014. Natural Gas: Guardrails for a Potential Climate Bridge.

  160. For comparison, 400 billion cubic metres (bcm) is equal to 3.5 times China’s current gas use, 20% of its current coal use, and greater than recent projections for the growth in coal over the next 20 years. It thus could be a very major element in a transition away from coal.

    See: International Energy Agency (IEA), 2012. Golden Rules for a Golden Age of Gas. World Energy Outlook Special Report on Unconventional Gas. Paris. LINK

  161. This section summarises the findings of an NCE background paper on the conditions under which natural gas might act as a bridge fuel to a low-carbon future. See Lazarus et al., 2014. Natural Gas: Guardrails for a Potential Climate Bridge.

  162. Lower range from: IEA, 2012. Golden Rules for a Golden Age of Gas. Upper range from: US Environmental Protection Agency (EPA), 2012. Global Anthropogenic Non-CO2 GHG Emissions: 1990-2030. EPA 430-R-12-006. Washington, DC. LINK

    CO2e estimates are not as given in the sources above, but rather are the authors’ calculations using updated IPCC estimates of the 100-year global warming potential (GWP) of methane, 34 (i.e. methane traps 34 times more heat in the atmosphere than CO2). See: Myhre, G., Shindell, D., Bréon, F.-M., Collins, W., Fuglestvedt, J., et al., 2013. Anthropogenic and natural radiative forcing. In Climate Change 2013: The Physical Science Basis. Contribution of Working Group I to the Fifth Assessment Report of the Intergovernmental Panel on Climate Change. T. F. Stocker, D. Qin, G.-K. Plattner, M. Tignor, S. K. Allen, et al. (eds.). Cambridge University Press, Cambridge, UK, and New York. LINK

  163. Bruckner et al., 2014. Chapter 7: Energy systems (IPCC AR5, Working Group III).

  164. US Environmental Protection Agency (EPA), 2014. Global Mitigation of Non-CO2 Greenhouse Gases: 2010-2030 – Executive Summary. EPA-430-S-14-001. Washington, DC. LINK

    Note that EPA uses a GWP of 21 for methane in its calculations; thus this is an underestimate of the GHG benefits.

  165. International Energy Agency (IEA), 2013. Redrawing the Energy-Climate Map. World Energy Outlook Special Report. Paris. LINK

  166. See, e.g., ICF International, 2014. Economic Analysis of Methane Emission Reduction Opportunities in the U.S. Onshore Oil and Natural Gas Industries. Prepared for the Environmental Defense Fund. Fairfax, VA, US. LINK

  167. United Nations Environment Programme (UNEP), 2011. Near-Term Climate Protection and Clean Air Benefits: Actions for Controlling Short-Lived Climate Forcers – A UNEP Synthesis Report. Nairobi. LINK

  168. See Lazarus et al., 2014. Natural Gas: Guardrails for a Potential Climate Bridge.

  169. For example, the United States has increased its GDP by 90% with only 21% more energy, Germany, by 60%, with 14% less energy, in the period 1990-2012 Analysis for the Global Commission. GDP data: The World Bank, n.d. GDP (constant 2005 US$), Energy use data: BP, 2013. BP Statistical Review of World Energy June 2013.

  170. International Energy Agency (IEA), 2013. Energy Efficiency Market Report 2013 – Market Trends and Medium-Term Prospects. Paris. LINK

  171. International Energy Agency (IEA), 2013. Energy Efficiency Market Report 2013 – Market Trends and Medium-Term Prospects. Paris. LINK

  172. Analysis for the Global Commission, drawing on scenarios discussed in: GEA, 2012. Global Energy Assessment, and: Bruckner et al., 2014. Chapter 7: Energy systems (IPCC AR5, Working Group III).

  173. International Energy Agency, 2012. World Energy Outlook 2012.

  174. Planning Commission of the Government of India, 2013. India Energy Security Scenarios 2047.

  175. Analysis for the Global Commission, drawing on: IEA, 2012. World Energy Outlook 2012; GEA, 2012. Global Energy Assessment, and Bruckner et al., 2014, 2014. Chapter 7: Energy systems (IPCC AR5, Working Group III).

  176. This is referred to as the Efficient Worldscenario in IEA, 2012. World Energy Outlook 2012. Others have queried whether such estimates could obscure “hidden costs” such as the missed opportunities to invest scarce capital in other priority areas. See, e.g., Allcott, H. and Greenstone, M., 2012. Is There an Energy Efficiency Gap? Journal of Economic Perspectives, 26(1). 3–28. DOI:10.1257/jep.26.1.3.

  177. Bianco, N., Meek, K., Gasper, R., Obeiter, M., Forbes, S., and Aden, N., 2014. Transitioning to a New Climate Economy: An Analysis of Existing and Emerging Opportunities in the United States. New Climate Economy contributing paper. World Resources Institute, Washington, DC. LINK

  178. Bruckner et al., 2014. Chapter 7: Energy systems (IPCC AR5, Working Group III).

  179. There also are estimates that suggest effects higher than 50% for some sectors and circumstances, but these are fraught with difficulties. See: Sorrell S., 2007. The Rebound Effect: An Assessment of the Evidence for Economy-wide Energy Savings from Improved Energy Efficiency. UK Energy Research Centre, London. LINK

  180.  International Energy Agency (IEA), 2011. World Energy Outlook 2011. Paris. LINK

    The emission reduction estimate is based on the reduction in energy usage reported in World Energy Outlook 2011, which corresponds to c. 2.3 Gt for 2030.  The lower range results from adopting a more conservative assumption and also accounting for overlap with other measures recommended in this report.  See: New Climate Economy, 2014 (forthcoming). Quantifying Emission Reduction Potential. New Climate Economy contributing paper. London. LINK

  181. Although these countries made great strides in energy productivity, it should be noted that changes in economic structure also played an important role.

  182. Blok, K., Höhne, N., van der Leun, K. and Harrison, N., 2012. Bridging the greenhouse-gas emissions gap. Nature Climate Change, 2(7). 471–474. DOI:10.1038/nclimate1602.

  183. US Department of Energy, 2013, Better Buildings Challenge Progress Update, Spring 2013LINK

  184. Smil, V., 2014. The Long Slow Rise of Solar and Wind. Scientific American, 310(1). 52–57. DOI:10.1038/scientificamerican0114-52. LINK

  185. IEA, 2011. World Energy Outlook 2011

  186. See: LINK and discussion of it in Chapter 3: Land Use.

Next Chapter: Economics of Change